

zemarinho/iStock via Getty Images
Introduction
My previous article on the iShares 20+ Year Treasury Bond ETF (TLT) forecast expected return and volatility. It demonstrated that TLT has a superior risk-return profile to the stock market. However, additional information is required to construct a portfolio. Specifically, the relationships between bonds and other asset classes, such as stocks and cash, need to be considered. First, this article introduces some common, problematic methods of portfolio construction and suggests a path forward. Then, it reviews market events since my previous forecast to determine whether any updates are warranted. Next, it discusses the economic scenarios that benefit bonds, cash, and stocks and estimates how each asset class will perform under various conditions. Afterwards, two thought experiments help frame the allocation decision. Lastly, I review some additional considerations that affect the relative weights of bonds, cash, and stocks in my portfolio.
Note: Unless otherwise stated, “bonds” refers to long-term treasuries, “stocks” means the S&P 500, and “cash” is any cash-like instrument such as bank deposits, CDs, money markets, or treasury bills.
Approach to Portfolio Construction
Portfolio construction and risk are arguably some of the most complex investment topics. As with anything complicated, it is tempting to reframe the discussion to answer easier, related questions. For example, I have recently seen many “sell all your stocks now” articles and ads across a variety of websites. In addition, I have met individuals who disproportionately own single stocks or pursue a single concentrated strategy exclusively. These approaches answer questions such as “what companies or strategies do I like the most?” as opposed to “what combination of investments with highly uncertain payouts will best match my goals, views, investment timeframe, and tolerance for loss?” Other less obvious and extreme examples exist as well. Consider the 60/40 stock and bond portfolio. This strategy seems to answer the question “what simple rule can I follow to create a balanced portfolio?” In a normal market environment, stocks are much more volatile than bonds, so holding 60% of a portfolio in stocks to both diversify and limit portfolio risk frequently does not make sense.
In addition, many investors are risk-averse or have a short time horizon and allocating such a large percentage is inappropriate. These rule-of-thumb type approaches also fail to consider whether there is a reasonable basis for investing in the underlying assets. When the Fed was artificially inflating the price of treasuries and the real return was negative, it seems hard to justify allocating 40% to bonds unless it was necessary. Another rules-based approach to portfolio construction is asset-liability matching (ALM). This approach is widely used in corporate finance and defined benefit plans when cash outflows can be forecast with precision. For individuals at-or-near retirement age who want predictable income, implementing ALM via a bond ladder can make sense. However, ALM is inappropriate when future cash needs are unpredictable or the individual holds certain assets, such as stocks, that have uncertain cash flows. Lastly, I believe that academic financial theory has subtly fallen into the reframing trap as well. It has sought to answer: “Assuming markets are efficient, asset returns are normally distributed, and accurate and precise estimates of volatility and correlations can be obtained, what combination of assets yields an optimal portfolio?” As Graham and Dodd observed, markets can be moody. As Nassim Taleb and Benoit Mandelbrot made clear, asset returns are much more chaotic than academics would like to admit. Lastly, portfolio optimization is highly sensitive to errors in estimates of asset volatility and correlations. This means that the optimizer finds the right answer to the wrong problem. Perfect becomes the enemy of good.
In searching for a reasonable approach to portfolio construction, industry practice can be informative. Professional money managers approach portfolio construction differently depending on whether they are traditional stock pickers versus quantitative funds. Traditional stock pickers typically improvise allocation based on mostly qualitative information. Quantitative funds are much more systematic but rely primarily on historical data, Modern Portfolio Theory, and quantitative techniques such as factor models and constrained optimization. I believe there are advantages to combining elements of both approaches.
The following sections of this article illustrate mostly qualitative considerations to determine what proportion of stocks and bonds to own. The underlying tenet is that critical thinking is required to determine a combination of investments that both yields an acceptable return and protects the portfolio against loss. This counters academic finance, which claims diversification is the only free lunch in investing. In my view, there is no free lunch. The grail is to invest in high return investments that are independent of or hedge each other. Portfolio volatility and the probability of loss decrease with each additional position. As I have stated in previous articles, long-term treasuries are likely to act inversely to stocks over the next year or so. Many investors with large stock allocations should consider adding long-term treasuries to their portfolios as imperfect hedges, particularly considering their high yield.
Forecast and Market Updates
My previous article forecast long-term treasury rates based on five possible scenarios. Since then, yields soared to over 5% in the fall, declined to their August levels, and then rose again. How does this affect my thesis? Not much. Even though the spike in rates was dramatic, yields never exceeded the Worst Case scenario of 5.3% and were not close to the Maximum scenario of 6%. The article anticipated the risks in the following sentence:
In the short term there are many factors that could cause a temporary spike in rates such as leveraged bets against treasuries, poor auction results, and other countries unwinding their holdings.
This rapid change in the market environment merits consideration. I have been surprised by the extremity of the bearish views in the fall and the bullish ones at the beginning of 2024. Also, market views have completely reversed even though economic fundamentals remain relatively unchanged. None of this alters the thesis that bonds are attractive relative to stocks. However, the euphoria over bonds is concerning. At the beginning of the year, the market was pricing a rate cut in March and six rate cuts in 2024. The Fed dot plot indicated three rate cuts in 2024, and subsequent events show the market was overly aggressive. Recently, the enthusiasm for treasuries has waned and rates have become more attractive again.
At the beginning of 2023, I owned only stocks and cash. As the spike in rates occurred in the fall, I gradually increased my allocation to bonds until rates reversed direction and reached around 4%. By the end of 2023, my allocation to intermediate and long-term bonds constituted about 20% of my portfolio. As additional volatility and negative sentiment occurs, I plan to continue to increase my position; although, the narrative of market participants has changed and another large rate spike seems unlikely.
Allocation Considerations
Economic Scenarios
This section analyzes allocation between bonds, cash, and stocks using economic growth and inflation as risk factors. At a high level, there are three key economic scenarios that determine the optimal outcomes for these asset classes. If inflation stays elevated or the Fed lowers rates slower than the market consensus, then the 1%+ differential between cash and treasury bonds is compelling. If a recession occurs, then long-term treasuries should be the winner. If the economy expands, then stocks are the likely the best bet. However, none of these scenarios is guaranteed. This frames the allocation decision but additional information is required. What is the magnitude of outperformance of each asset class under the different scenarios? How should views regarding the likelihood of each scenario be incorporated? What is the relative risk and return of each asset class?
Poppertech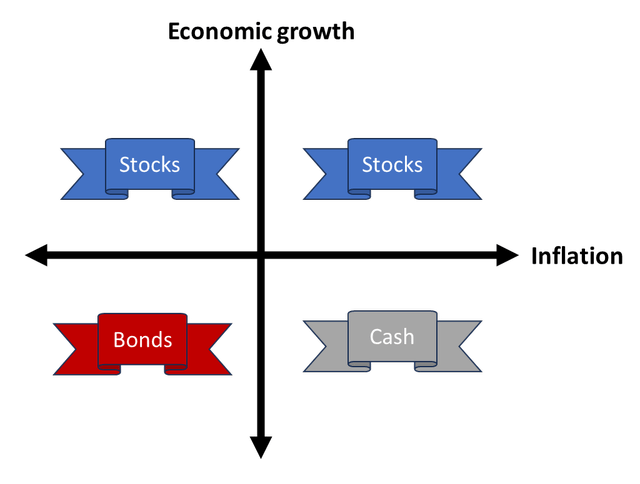
Suppose the following simplistic assumption is introduced: the expected return of each asset class is 5% over the next year. The purpose of this is to analyze risk in isolation. Although simplistic, it is not completely arbitrary: trailing earnings yield of the S&P 500 is 4.4%; YTM of 30-year bonds is 4.4%; and cash yields are currently about 5.4%. Next, assume both inflation and economic growth are binary; each can either be high or low, resulting in four possible scenarios. Inflation and economic growth are related, and certain scenarios need to be adjusted to account for the interdependence. For example, high inflation would likely result in rising interest rates, which would limit economic growth. Therefore, moderately high inflation coupled with high economic growth would be more realistic. The following analysis enumerates each scenario and estimates the performance of each asset class.
High Economic Growth and Moderately High Inflation
- Stocks appreciate ~15% as earnings slightly beat 2024 consensus growth
- Cash returns ~5% as rates stay elevated
- Bonds depreciate ~10% as long-term rates increase ~.5% and duration is ~20
High Economic Growth and Low Inflation (No Landing)
- Stocks appreciate ~25% as earnings increase and multiples expand(~TTM performance)
- Cash returns ~5% as rates slowly decline
- Bonds appreciate ~10% as long-term rates decrease ~.5%
Low Economic Growth and High Inflation (Stagflation)
- Stocks depreciate ~25% as multiples contract (~2021-2022 drawdown)
- Cash returns ~6% as rates increase
- Bonds depreciate ~20% as long-term rates increase ~1%
Low Economic Growth and Low Inflation (Recession)
- Stocks depreciate ~30% as earnings decrease and multiples contract (~2020 drawdown)
- Cash returns ~4% as rates decline
- Bonds appreciate ~20% as long-term rates decrease ~1%
Poppertech
Thought Experiments
From a risk perspective, stagflation and recession are the two scenarios of primary concern. The following thought experiments should clarify how allocation between bonds, cash, and stocks affect portfolio risk:
- Hypothetical portfolios are long-only
- Goal is to immunize portfolio against loss
Stagflation
- Assume portfolio holds equal weights in bonds and stocks
- Cash constitutes the remainder of portfolio
- ~80% cash position required to immunize against loss
Recession
- Assume fully invested (no cash allocation)
- 50% more of the portfolio must be invested in bonds than stocks to break even
- 60% bonds would be the minimum allocation
Although simplistic and limited, these thought experiments convey a few important points. First, diversifying across these asset classes does not protect against stagflation, which is why the cash allocation is so high. Given its low return, cash provides minimal protection. Clearly, a real asset or company whose profits are tied to real asset prices would hedge better. For example, oil futures or an oil exploration company. I believe this scenario is unlikely to occur over the long term and will not analyze it in depth. However, it seems like inflation and rates may be higher than current market expectations over the next six months. Clearly, a very large allocation to cash is unnecessary and extreme, but cash grants an option to invest in other asset classes when opportunities arise. For this reason, a significant cash position of perhaps 20% or higher is worth considering.
Second, bonds are likely to protect against losses in the stock market during a recession; however, the upside to bonds in this scenario is less than the downside to stocks. Therefore, a larger allocation to bonds than stocks is required to hedge against loss.
Analysis Limitations
As already indicated, this analysis is simplistic, and it seems worth considering its limitations. Clearly, the focus on only three asset classes is a major constraint. Real assets tend to be one of the most direct ways of hedging inflation. If stagflation is a primary concern, then exposure to them may mitigate portfolio loss. Unlike stocks and bonds, real assets typically cost money to store and maintain. In addition, technology tends to lower their inflation-adjusted cost of extraction or creation over time. As a result, they behave more like an insurance policy than a diversifier. Alternatively, high quality companies with exposure to real assets are a much more indirect hedge, but can appreciate significantly in the long term. Unless insurance is required, a tilt in a stock portfolio towards real assets may be more desirable if inflation is a primary concern.
Another major limitation of this analysis is that only considers returns over the next year. If interest rates decline, then the long-term return of cash is unlikely to be 5%. As a result, cash holdings should be lower than the analysis suggests. Lastly, it does not incorporate any views. As indicated in my previous articles, I believe that a recession should be a primary concern. This boosts the allocation to bonds.
Specifying Portfolio Weights
At some point, analysis must end, and the portfolio must be invested based on views, perceived risk, and level of conviction. Given my views and the above analysis, I want a higher allocation to bonds than stocks in this environment. However, this does not mean that I sell all my stocks and buy only bonds. First, taxes are a factor. Next, as indicated in my forecast for TLT, there is significant uncertainty regarding the timing, direction, and magnitude of interest rate changes. This is true for stock prices as well. I want the ability to increase my allocation to both stocks and bonds when opportunities arise. If interest rates increase above 5%, I want the ability to increase my allocation to bonds to 50% or more of my portfolio. If stocks plummet by 30%, I want the option to allocate my entire portfolio to equities. Also, the 4.4% YTM of bonds is low from an absolute return perspective. When combined, these considerations lead me to hold a significant amount of cash. Lastly, my allocation to stocks is currently about 30% of my portfolio, and I intend to reduce my exposure a little more. Until now, “stocks” has meant the S&P 500. However, my stock portfolio tilts disproportionately to high quality names in low beta sectors such as healthcare (e.g. Novartis). Additionally, I tend to overweight mid-cap, international, and special situations stocks, and Philips is an example that combines these themes. Many of these differences from a market cap weighted index mitigate losses from broad market moves. In addition, I have been reducing my exposure to cyclical industries such as technology and industrials. Therefore, my exposure to equities is less than the 30% portfolio weight would suggest.
Credit: Source link