

Torsten Asmus
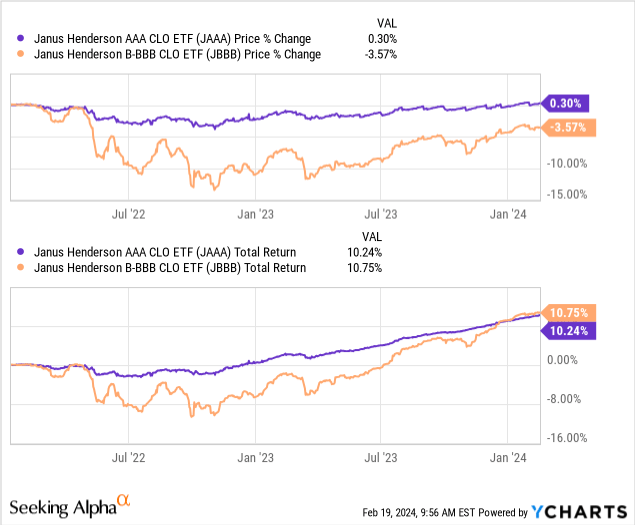
Today’s article dials in on the Janus Henderson AAA CLO ETF (NYSEARCA:JAAA) and its close counterpart, the Janus Henderson B-BBB CLO ETF (JBBB). The two funds have subtle differences that could lead to differentiated returns in the current credit environment. Although we aren’t opponents of the Janus Henderson B-BBB CLO ETF, we favor Janus Henderson AAA CLO ETF for the time being, as we think the latter provides a better risk-return outlook for the remainder of the year.
Without further ado, let’s take a look at each vehicle and the influencing variables that we believe will result in differentiated returns.
A Summary of Each Portfolio
JAAA
JAAA ETF primarily invests in AAA-rated collateralized loan obligations, aka CLOs. A CLO is a floating-rate leveraged loan provided to an entity, which generally thrives when interest rates rise as it provides latitude for CLO providers to profit from widening spreads (over the reference interest rate). Such loans are typically packaged into a vehicle with a homogenous theme. Although a small number of other securities rest in its portfolio, JAAA ETF’s theme of choice is AAA-rated CLOs with maturities between 3 and 5 years. In other words, the portfolio holds a bullet structure exposed to medium-term interest rates and coherent credit spreads.
I collated JAAA ETF’s portfolio data for you below, with the maturity structure being succeeded by asset types.
Maturity Structure (Janus Henderson) Sector (Janus Henderson)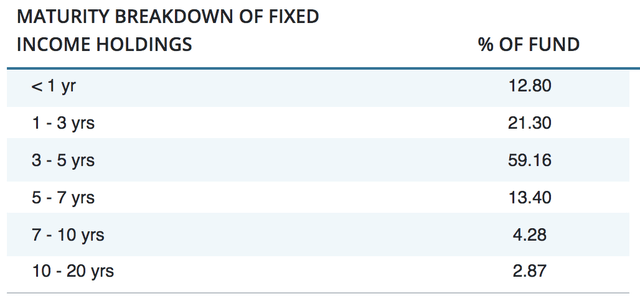
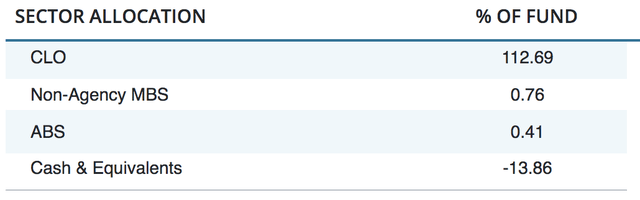
Aside: 102.76% of the fund’s 113.86% gross long exposure is to North America.
JBBB
JBBB ETF follows the same framework as JAAA. However, the ETF primarily invests in BBB CLOs with maturities between 5 and 7 years. While also structured as a bullet portfolio, JBBB is slightly longer-dated than JAAA.
In the same fashion as the JAAA section, displays of JBBB ETF’s portfolio can be found below.
Maturity Structure (Janus Henderson) Sector (Janus Henderson)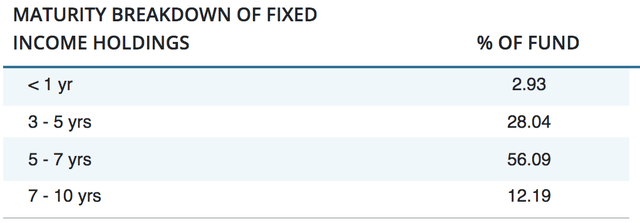

Aside: 99.13% of the ETF’s exposure is to North America.
Duration
The first component that stood out to us when assessing the vehicles was the duration differentials of the two funds. An effective duration measures a bond portfolio (or asset’s) change to a 1% parallel shift in interest rates. However, note that the financial markets are forward-looking and not priced in arrears; therefore the interest rate shifts that influence these assets will be drawn from the yield curve and not the Federal Reserve’s current policy rates (although policy rates do influence the yield curve).
Drawing inferences from the latest Fed minutes meeting and the yield curve, it’s evident that some think interest rates will stay higher for longer, which is a fair argument if one considers the resilience of core inflation. However, we think such an argument is too retrospective in nature. In fact, we think 2024 will be characterized by lower consumer sentiment, stretched household balance sheets, flatter non-core inflation, and ultimately a small economic contraction. As such, we think the yield curve’s current level is overcooked and will settle lower in due course. If such an event had to occur, the JAAA ETF would experience favorable price impact due to its positive duration, whereas the JBBB would likely suffer from unfavorable price impact due to its negative duration.
US Yield Curve (worldgovernmentbonds.com)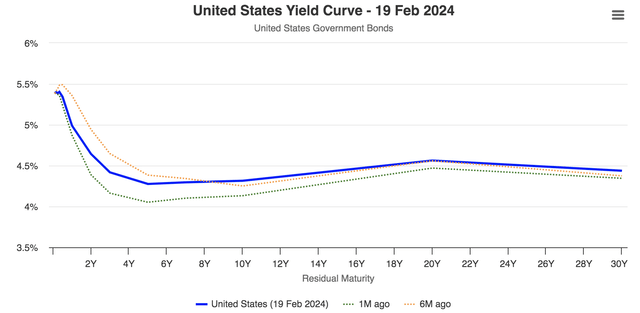
Below is a diagram of the duration differentials between the two vehicles. Sure, a 0.14 effective duration differential isn’t overly substantial, but it can have a telling effect in a volatile yield curve environment like today’s. Moreover, duration differentials can increase once interest rates start shifting due to the enhanced volatility of fixed-income assets (caused by factors other than the yield curve).
Durations of JAAA and JBBB. (Author’s Work – Derived from Janus Henderson)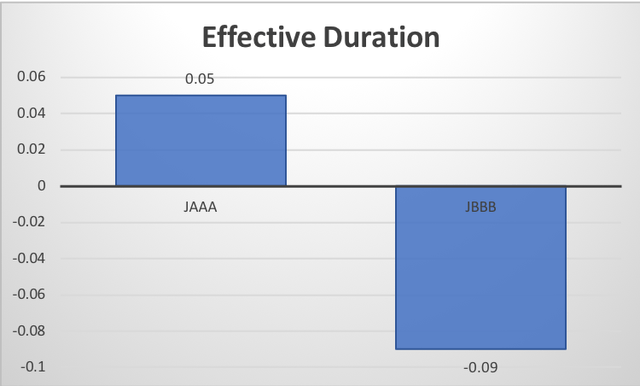
To consolidate this section, we think there is a higher probability of interest rates decreasing in 2024 than increasing (or staying constant). Therefore, we favor the positive duration aspect of JAAA over JBBB’s negative duration.
Credit Spreads
A secondary effect that can be very influential is the credit spreads outlook.
Option-Adjusted Spreads (St. Louis Fed)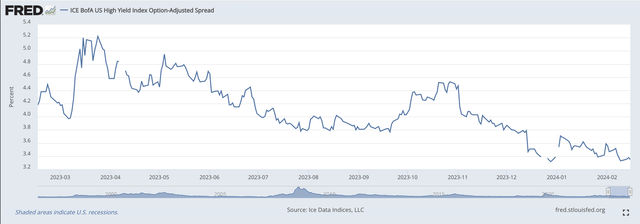
Credit spreads have tapered in the past few months, providing a tailwind to riskier debt vehicles such as JBBB. However, as mentioned before, the financial markets are based on what’s ahead instead of what has already occurred. In our view, lower yield curve levels will give rise to credit spreads at the short end of the maturity curve and in the medium term. We think this will occur due to the yield curve’s activity but also due to our belief that the economy is set for a slowdown, which could trigger numerous credit events, leading to higher ratings downgrade risk within the leveraged loan environment. If such a pattern had to occur, we would likely see BBB debt underperform AAA debt as investors flock toward safety. As such, we prefer JAAA over JBBB for the time being due to its softer exposure to the credit spread cycle.
The credit ratings differentials were inserted earlier in the article, but I re-added them below for your convenience.
JAA’s Exposure (Janus Henderson)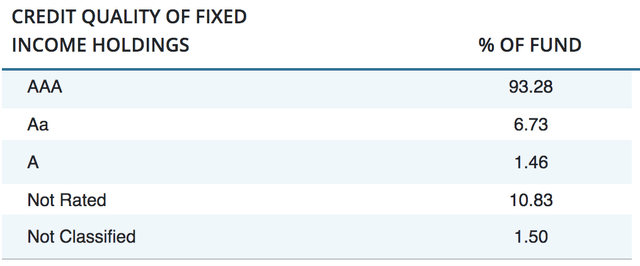
Note About JAAA: JAAA uses short cash positions to net its exposure out to 100%; its gross bond exposure is more than 100%.
Janus Henderson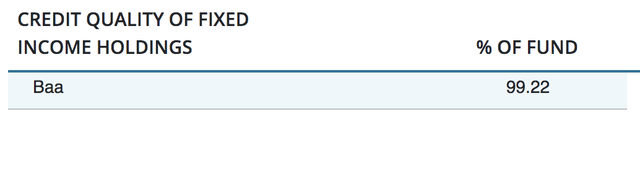
To summarize here, we think there is a higher probability of credit spreads rising for short- and medium-term securities. Therefore, we prefer JAAA due to its lower credit exposure as a high-quality fixed-income vehicle.
Dividends
The two funds are quite similar in terms of dividends, with JBBB showcasing higher but more cyclical dividends than JAAA. Regardless of which one you choose, past data and the nature of the investment instruments suggest that dividends will be strong throughout the economic cycle.
The diagram below summarizes key dividend data. Note that both the funds distribute monthly, which is critical to consider when reading annualized data.
| Metric | JAAA | JBBB |
| Trailing Dividend Yield | 6.17% | 8.05% |
| Last Payout Date | 7 Feb. 2024 | 7 Feb. 2024 |
| Consecutive Years Dividend Growth | 3 | 1 |
Source: Seeking Alpha
We don’t have a preference here, we think the dividend profile of each of the ETFs is strong with the higher cyclicality of JBBB being made up for with an enhanced payout.
Risk Appraisal
We noticed a few noteworthy factors when doing a risk appraisal on both funds. A discussion about the data follows the exhibits below.
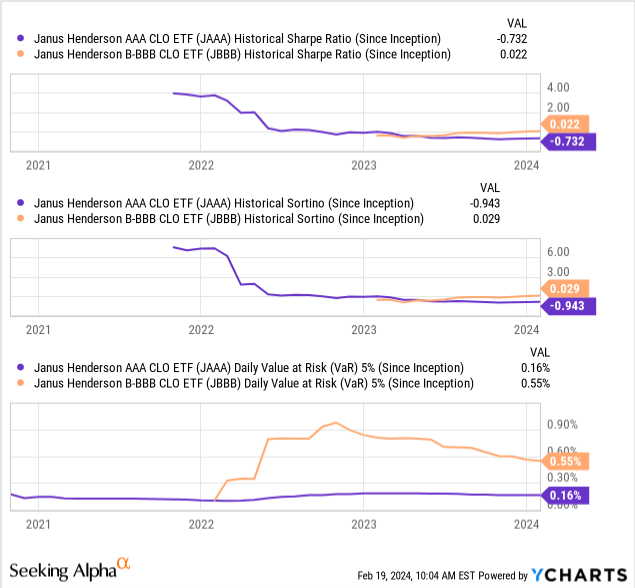
- Sharpe Ratio: This ratio measures an asset or portfolio’s excess return over the risk-free rate with respect to total volatility. JBBB has a better Sharpe Ratio, which probably stems from the fact that JAAA’s returns aren’t much higher than the risk-free rate. Nevertheless, the negative ratio should be considered a risk when investing in JAAA as it suggests the asset may not produce best-in-class risk-return optimization.
- Sortino Ratio: This ratio measures downside returns relative to downside volatility, aka semi-deviation. As with the Sharpe ratio, JBBB hosts superior risk-adjusted returns.
- Daily Value at Risk at 5%: This is a measurement of the average amount of value the asset has lost in 5% of its trading days. JBBB’s VAR is much higher, which probably owes to its higher credit exposure. We find JAAA’s lower VAR very attractive, given the yield and credit curve volatility embedded in today’s credit markets.
Concluding Thoughts
Although resilient inflation has raised the possibility of sustained interest rates or even an interest rate hike, we think the probability of lower interest rates in mid-to-late 2024 remains high. As such, we prefer a positive duration CLO vehicle in Janus Henderson AAA CLO ETF instead of a negative duration CLO fund such as Janus Henderson B-BBB CLO ETF.
Furthermore, we think the credit spread maturity curve is set to rise at the short-to-intermediate end, given our outlook on the yield curve and our judgment call on the economy. Thus, we hold the view that it would be better to minimize credit exposure for the time being by opting for JAAA instead of JBBB.
Both vehicles provide solid dividends, with JAAA’s being less cyclical. We prefer the less cyclical option at this stage, as spreads over reference rates are likely to fluctuate significantly in the coming quarters.
Lastly, a risk appraisal highlights a few concerns regarding JAAA’s volatility-adjusted returns. Nevertheless, our choice remains JAAA instead of JBBB.
Consensus: Buy Rating with an Indefinite Horizon.
Credit: Source link