

Nitat Termmee/Moment via Getty Images
Synopsis
Boyd Group Services (TSX:BYD:CA) past revenue growth has shown a strong recovery from the impact of COVID-19. However, adjusted margins were under pressure due to the supply chain and tight labour market challenges. Looking ahead, the highly fragmented US collision repair industry is an opportunity for BYD:CA to gain market share and growth. Therefore, it is expected to bolster its growth outlook. In addition, as its collision location grows, it will attract more insurers to work closely with them, which will strengthen its revenue growth. Despite all the tailwinds, the upside potential in BYD:CA’s share price lacks sufficient margin of safety. Its share price has appreciated by ~43% in one year. Therefore, I am recommending a hold rating for BYD:CA at the moment.
Overview
BYD:CA is the leading operator of collision repair shops by number of locations in North America. It is ranked third among the largest retail auto glass operators in the US. It is one of the largest auto-body repair firms in North America in terms of sales and number of locations. The only publicly listed company primarily focused on auto collision and glass repair in North America. It has 803 locations in the US and 129 locations in Canada, ~92% of the revenue contribution comes from the US, while the remaining ~8% is in Canada. More than 90% of its payors are insurance companies, while the remaining are from Customers pay/Others. Its full-service repair shops offer services in collision repair, glass repair, replacement, and calibration.
Author’s Chart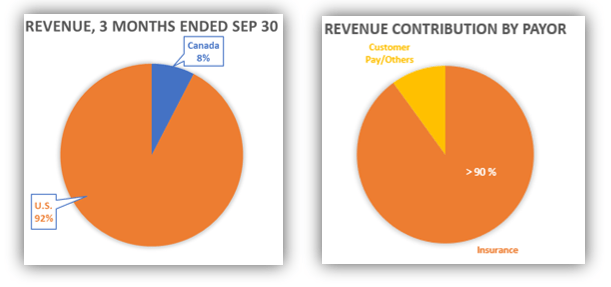
Historical Financial Analysis
Over the years, BYD:CA has demonstrated strong revenue growth in 2021 and 2022. In 2020, revenue growth declined as the company was impacted by COVID-19. However, in 2021, revenue growth started to recover. The growth in 2021 was driven by growth in same-store sales [SSS] of 7%, which was driven by business returns following the disruption caused by COVID. In 2022, revenue growth continues to be strong and is also driven by strong growth in SSS, which grew by 19.8%.
Author’s Chart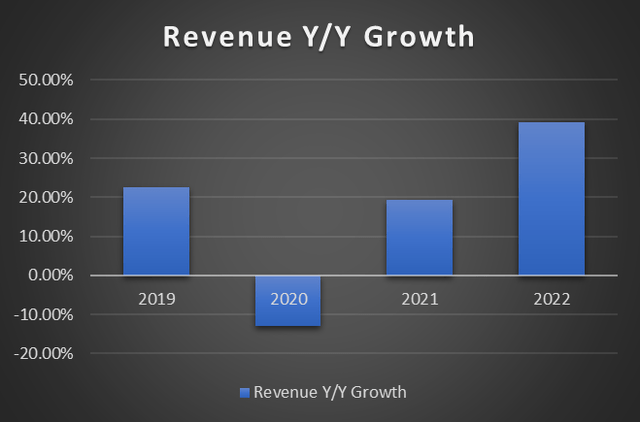
In terms of profitability, I will be looking at its gross profit margin, adjusted EBITDA margin, and adjusted net earning margin. Over the years, its gross profit margins have been under slight pressure. In 2022, gross profit margin is ~44.7% vs. 2020’s 46%. The contraction was caused by decreasing margins on the labor it charges for services and on the parts it sells, plus it was selling more parts than labor services. In addition to that, the tight labor market has also negatively impacted labor margins. The global supply chain disruption caused by the pandemic didn’t help either.
As a result of supply chain disruption and wage inflation, both adjusted EBITDA margin and adjusted net income margin were negatively impacted as well. In 2022, BYD:CA reported adjusted EBITDA margin and adjusted net income margin of 11.2% and 1.7%, respectively, vs. 2020’s 14% and 2.6%.
Author’s Chart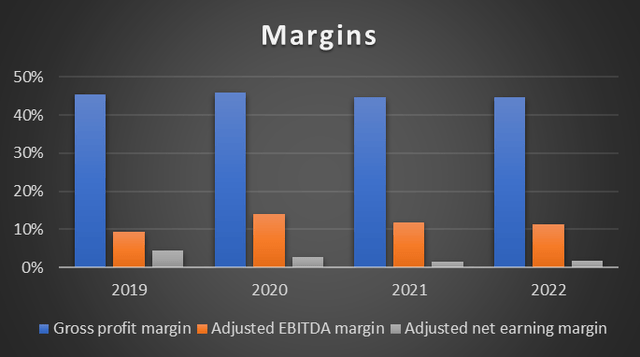
Opportunity in a Highly Fragmented Industry
The US collision repair industry is highly fragmented, and its annual revenue for this industry is estimated to be around $47.6 billion. Single shops make up 56% of the collision repair market share in the US, with 35.7% being Multi Shop Operators [MSO], while the remaining 10.3% are small MSO and franchises. MSO is a collision repair operator that has more than one location under the same ownership, and BYD:CA is one of the top 3 consolidators in this industry. The remaining two consolidators are Caliber Collision and Crash Champions, both unlisted. This highly fragmented industry signals market share opportunities for BYD:CA to gain market share through consolidation and economies of scale. BYD:CA can expand its geographic footprint to increase its market share and leverage economies of scale. In 2023, they have already added 78 new single locations; 58 of them are through acquisitions, and the remaining 20 are start-up locations, allowing BYD:CA to grow both organically and through acquisition. The top 3 consolidators had a 22.5% market share in 2022, an improvement from their 18.4% share in 2021. It is forecast that they will aggressively expand their business and reach a market share of 32% in this industry by 2027. This opportunity aligns with BYD:CA’s goal to achieve double the size of its business by 2025, based on 2019 revenues.
Author’s Chart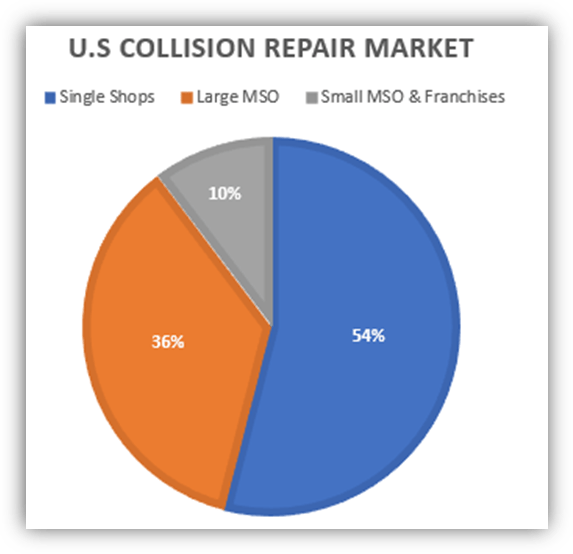
As the bulk of the revenue is directed by insurers, Direct Repair Programs [DRPs] are crucial for these MSO. Insurers look for collision repair shops within their coverage that can provide fast, quality service at a low cost. Repair shops need to meet a certain set of standards before the insurers pay for repairs. With the growing volume of collision repair claims, insurers have a preference for DRPs as they allow for better management of repair claims and customer satisfaction, especially those that are arranged with multi-location operators like BYD:CA.
Insurance partners depend on MSO to expand their operations to multiple new locations that are within their region of coverage. The MSO, in return, seek benefits from incremental sales through their relationship with insurance partners. BYD:CA has been aggressively acquiring and adding new repair locations over the years, reaching a total of 932 locations in 32 U.S. states and 5 Canadian provinces. BYD:CA is strategically positioned to take advantage of these trends, as insurers ultimate goal is to ensure policyholders have access to quality, efficient, and cost-effective repair services and therefore would prefer to work with larger and more reliable vendors like BYD:CA.
Investor Relations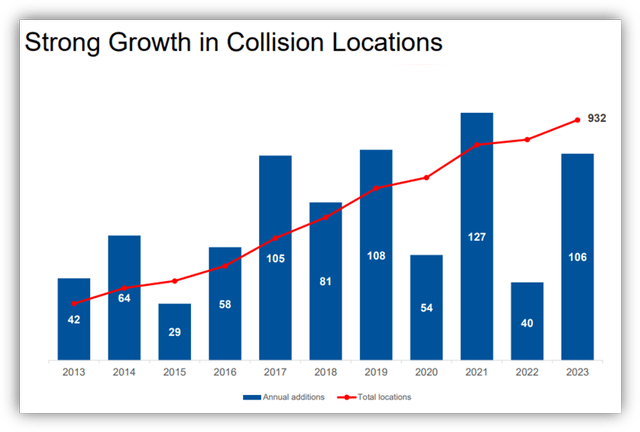
Valuation Model
BYD:CA is the only publicly listed company primarily focused on auto collision and glass repair in North America. The other two largest MSOs are Calibre Collision and Crash Champions, which are not listed. Therefore, relative valuation against direct competitors is not feasible.
Therefore, in order to determine BYD:CA’s fair value, I will be using a simplified 5-year DCF model that uses a terminal value exit to calculate its intrinsic value. For 2023 and 2024, the revenue growth rates I used for BYD:CA are in line with the market consensus of ~20% and ~13.2%, respectively. Given the highly fragmented industry, which provides opportunities for BYD:CA to grow its market share, along with the robust ecosystem and strong relationships BYD:CA has created with insurance companies, these factors are anticipated to provide positive tailwinds for BYD:CA’s growth outlook. Therefore, the market revenue estimates are justified as they echo the same sentiment. For 2025 to 2027, I model the growth rate to taper down toward the terminal growth rate. This ensures that my model remains conservative and that the growth rate does not experience a sharp drop when the terminal value is calculated.
BYD:CA’s 5-year median cash flow from operations [CFO] as a percentage of revenue is ~11%. In my model, I utilized 2022’s CFO as a percentage of revenue and extrapolated it for the next 5 years. Since it is in line with its 5-year median, it ensures that my model remains conservative. Its CAPEX’s 5-year median was 1% of revenue, and I extrapolated this rate for the next 5 years to ensure that it is conservative as well.
To calculate the terminal value, I require a terminal growth rate. A good proxy for this would be the US’s average annual GDP growth rate, which is ~3.20%. The reason I’m using the US, although BYD:CA is a Canadian firm, is because more than 90% of its revenue is generated in the US. Using the 2027 FCF, WACC, and terminal growth rate and applying them to the Gordon Growth formula, my terminal value came up to $10.52 billion, or a present value of $6.89 billion.
Using BYD:CA’s WACC to discount its future FCFF, the sum of the present value of its future FCFF amounts to $1.91 billion. Hence, by adding the present value of its FCF to the terminal value, its implied present enterprise value is calculated to be $8.81 billion. Based on the conservative assumptions discussed above, my implied intrinsic value for BYD:CA is ~$344. Compared to its last traded price, the upside potential of 12% lacks sufficient margin of safety. Therefore, I am recommending a hold rating.
Author’s Valuation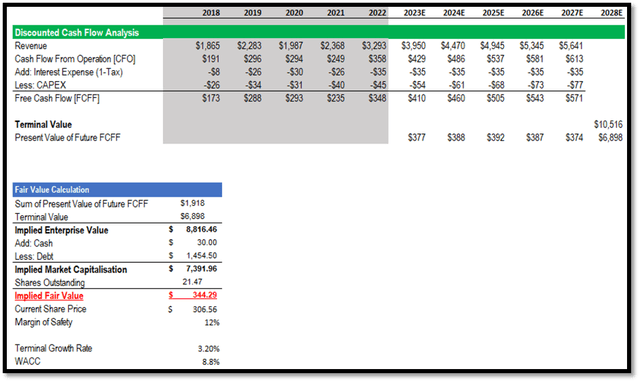
Risk
The upside risk associated with my hold rating is in regards to BYD:CA’s margins. As we know, currently, its margins are sitting below historical levels as they were impacted by supply chain disruption and a tight labour market. As BYD:CA’s margins recover, this will lead to an improved profitability outlook for the company. If it is able to recover to historical levels or surpass them, the market will revise its expectations for BYD:CA upwards, leading to share price appreciation.
Conclusion
In conclusion, BYD:CA’s historical financial results have demonstrated strong revenue recovery from the impact of COVID-19. In 2021 and 2022, revenue year-over-year growth was at double-digit rates. Despite this, its adjusted margins were contracting due to supply chain disruptions and a tight labor market challenge. As of 2022, its margins were still below historical levels.
Looking ahead, the highly fragmented US collision repair industry is anticipated to provide BYD:CA with the opportunity to grow its market share through consolidation. As BYD:CA grows in size, it provides it with multiple benefits, such as enjoying economies of scale as well as attracting more insurers to partner with it. Since 2013, BYD:CA has been consistently growing its collision location count. Despite the tailwinds, my model indicates a modest upside potential, which, in my opinion, lacks sufficient margin of safety. Its share price has appreciated more than 40% over a period of one year. Therefore, I am recommending a hold rating.
Editor’s Note: This article discusses one or more securities that do not trade on a major U.S. exchange. Please be aware of the risks associated with these stocks.
Credit: Source link