

Westend61/Westend61 via Getty Images
Over the past few years, the markets have been through the wringer amid geopolitics, gyrating commodity prices, the capital shortage era, the bear market induced by it, and a few false rebounds triggered by inflation data deviating from expectations. Nevertheless, as the dovish narrative prevailed, a massive recovery resulted in the S&P 500 teetering around the 5,000 landmark. There is no denying that beating the U.S. flagship index was an exceptionally tough task over that period. But the Capital Group Core Equity ETF (NYSEARCA:CGUS) managed to do that. And I have a Buy rating on it.
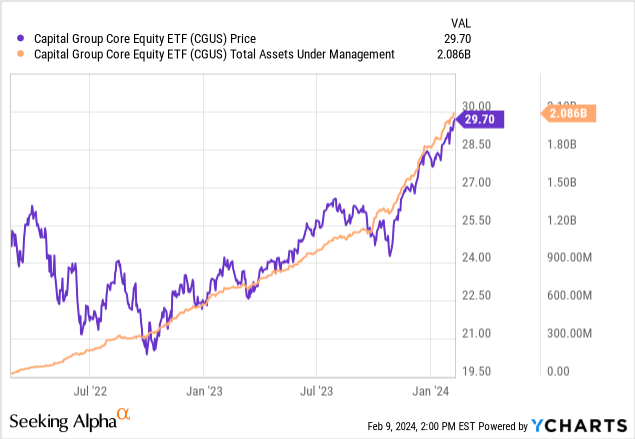
What is CGUS? This is an actively managed investment vehicle that was incepted in February 2022. Since then, its AUM has risen to more than $2 billion.
On its website, it is said that
Like all Capital Group funds, it utilizes The Capital System, which is designed to help our portfolios participate in strong market environments and dampen volatility in challenging ones.
In the summary prospectus, it is mentioned that the ETF
invests primarily in common stocks of companies that the investment adviser believes demonstrate the potential for appreciation and/or dividends.
Regarding country selection, CGUS
may invest up to 15% of its assets, at the time of purchase, in securities of issuers domiciled outside the United States.
My calculations show that CGUS’ holdings have about 54% weight in the iShares Core S&P 500 ETF (IVV); companies present in IVV account for approximately 83% of CGUS’ net assets. In terms of sectors, compared to the S&P 500 ETF, the fund is significantly overweight in industrials and underweight in information technology. The chart below was prepared using data from the iShares Core S&P Total U.S. Stock Market ETF (ITOT), CGUS, IVV, and Seeking Alpha.
Created by the author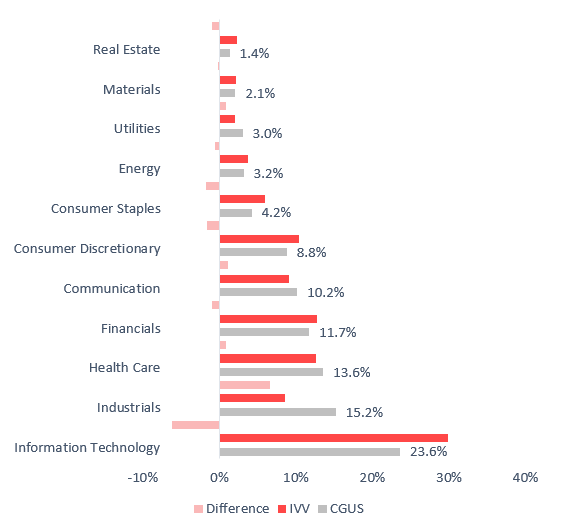
Below, I would like to outline a few reasons why investors should consider the ETF regardless of the market environment, be it a correction driven by the demolition of false hopes for the first interest rate cut sooner rather than later or a continuing uptrend in growthier stocks lifting the S&P 500 to a new all-time high.
Reason #1: outstanding performance since inception
As I said above, CGUS is an alpha-generating ETF. To corroborate, below is the annualized performance data for the fund and IVV.
| Portfolio | CGUS | IVV |
| Initial Balance | $10,000 | $10,000 |
| Final Balance | $11,686 | $11,418 |
| CAGR | 8.47% | 7.17% |
| Stdev | 18.51% | 19.83% |
| Best Year | 27.71% | 26.32% |
| Worst Year | -9.83% | -11.02% |
| Max. Drawdown | -20.68% | -20.28% |
| Sharpe Ratio | 0.33 | 0.26 |
| Sortino Ratio | 0.48 | 0.38 |
| Market Correlation | 0.99 | 1 |
| Upside Capture Ratio | 94.86% | 101.58% |
| Downside Capture Ratio | 87.19% | 97.66% |
Data from Portfolio Visualizer
As it can be seen, the Capital Group ETF delivered a compound annual growth rate of 1.3% stronger while also having a lower standard deviation and a higher total return in its best year (it was 2023). In terms of risk-adjusted returns (measured using the Sharpe and Sortino ratios), CGUS was again ahead of IVV. And while not being able to capture more upside, it nonetheless delivered a much more comfortable downside capture ratio.
Importantly, CGUS was not only less afflicted amid the bear market in 2022 (March–December), but it also managed to outpace the S&P 500 fund during the 2023 recovery.
| Year | CGUS | IVV | Difference |
| 2022 | -9.83% | -11.02% | 1.19% |
| 2023 | 27.71% | 26.32% | 1.39% |
| 2024 | 1.48% | 1.58% | 0.10% |
Data from Portfolio Visualizer
Moreover, CGUS beat IVV in 15 out of the 23 months in the period discussed (March 2022–January 2024). That is certainly impressive. A minor disappointment, though, is that CGUS is lagging IVV a bit this year.
Seeking Alpha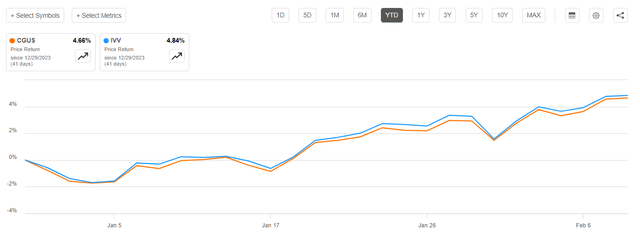
Reason #2: harmonious factor mix with a growth tilt
As of February 7, CGUS had 120 equities in its portfolio. They are mostly U.S. companies, yet there are a few exceptions. Among the most notable are Airbus SE (OTCPK:EADSY) (Paris ticker AIR), British American Tobacco p.l.c. (BTI) (London ticker BATS), and B3 S.A. (OTCPK:BOLSY) (São Paulo ticker B3SA3). CGUS also has exposure to the common stock of SK Hynix Inc. (KOSE ticker A000660), a Korean semiconductor company; it has a weight of about 40 bps in the portfolio. It is essential to note that in my analysis of style factors presented below, I used the data for U.S.-listed securities only (tickers were adjusted); in this regard, I have removed SK Hynix since HXSCL has been defunct since July 2018.
So does this outperformer have a more compelling factor balance than IVV? It mostly does, as the following chart vividly illustrates:
Financial data as of February 8 (Calculated by the author using data from Seeking Alpha and the fund)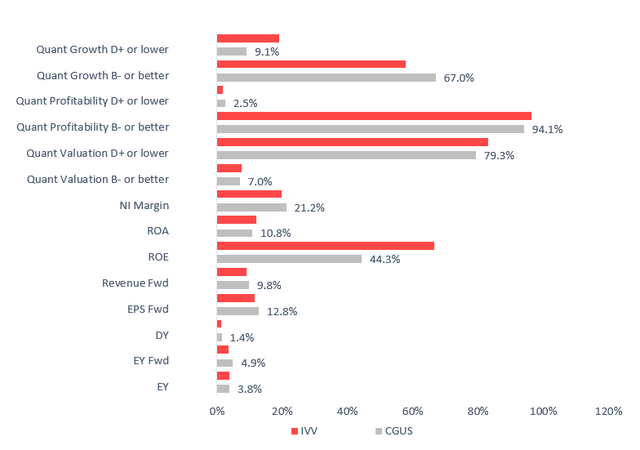
First, CGUS is relatively cheaper than IVV as it has smaller exposure to companies with a D+ Quant Valuation grade or worse. Next, its weighted-average market cap is lower (partly because it has shares in all the Magnificent Seven bellwethers except for Tesla (TSLA)), while the P/S ratio is lower as well, as shown below.
| Fund | Market Cap | P/S |
| CGUS | $650.98 billion | 7.18 |
| IVV | $798.7 billion | 7.57 |
Calculated by the author using data from Seeking Alpha and the fund
Earnings yield-focused investors would likely point out here that CGUS’ and IVV’s EYs are on par; nevertheless, my calculations show that forward EYs are materially different (4.9% vs. 3.63%), with the Capital Group fund having a clear edge. Next, its WA dividend yield is also higher, though just marginally, by a few bps. One of the possible reasons is that, precisely like IVV, the fund is content with the presence of non-dividend-paying names. They account for close to 20% of its net assets, with examples including Adobe (ADBE) and Amazon (AMZN).
Second, on the growth front, CGUS is boasting solidly larger exposure to companies with a B- Quant Growth grade or higher (67%), while its allocation to those with poor growth characteristics is a bit smaller. The weighted-average forward EPS and revenue growth rates are telling as well.
Third, while the fund is not radically ahead of IVV regarding quality, it does have advantages on that front as well. For example, it has a stronger weighted-average net margin. Unfortunately, its Return on Assets is weaker by about 1.3%; nevertheless, it is still confidently above the 10% milestone I consider desirable for large-cap portfolios. It has substantially lower Return on Equity, but the difference here is driven primarily by companies with burdensome borrowings and abnormally low shareholder equity (including Oracle (ORCL), which is absent in the CGUS portfolio), which bolstered IVV’s figure. In terms of exposure to companies with a B- Quant Profitability rating or higher, CGUS is slightly behind, though still with a massive allocation of 94%.
Final thoughts
CGUS is an actively managed investment vehicle offering exposure to an IT-heavy basket of U.S. equities as well as a relatively small footprint in overseas equities, including both emerging and developed markets.
There are two essential reasons why I believe investors should consider CGUS: its outstanding performance and harmonious factor mix with a growth tilt. However, this vehicle is obviously not without risks and disadvantages. Compared to its major plain-vanilla passively managed counterparts, CGUS’ main downside is a 33 bps expense ratio; for context, IVV has a microscopic 3 bps ER. Next, though reasonable at 34%, its turnover is much higher compared to IVV’s 3%. Also, it should be noted that in the event of a profound market decline that might be triggered by inflation and/or monetary policy surprises or any other factor that will adversely affect longer-duration equities, CGUS will likely suffer, though I anticipate its loss will not be as deep as IVV’s.
Credit: Source link