
MicroStockHub/iStock via Getty Images
Apple Inc. (NASDAQ:AAPL) has showcased strong performance recently, driving the stock to unprecedented highs. Yet, it is wise to assess the risks and opportunities at these elevated price levels. This article presents a contingency plan for existing shareholders and proposes entry points for potential investors. It emphasizes the importance of setting suitable stop-loss levels and actively managing risk exposure, considering broader technology market trends and industry performance.
A Macro Perspective
The technology sector in the US has spearheaded the rally since January 2023, consistently outperforming other economic sectors throughout the past year. Its strength has been notably pronounced in the last month, contrasting with weaknesses observed in energy, basic materials, real estate, and utilities. While companies in the consumer electronics industry have demonstrated solid performance over the past twelve months, they are showing signs of a notable slowdown in recent weeks. In contrast, computer hardware manufacturers appear more resilient amid current market conditions.
finviz finviz

The Vanguard Information Technology Index Fund ETF (VGT) continues its parabolic ascent, reaching a new All-Time High [ATH] as it runs in the final wave of a steep five-wave impulse sequence. While its exponential moving averages [EMAs] suggest it may be overextended, its consistent relative strength compared to the broader technology market, represented by the Nasdaq Composite (IXIC), and robust positive momentum in the Moving Average Convergence/Divergence [MACD] indicate a solid upward trend since January 2023. The current wave has reached a logical extension compared to the previous two impulse waves. Although further gains cannot be ruled out entirely, there is an increasing likelihood of the sequence completing, potentially leading to a retracement.
Author, using TradingView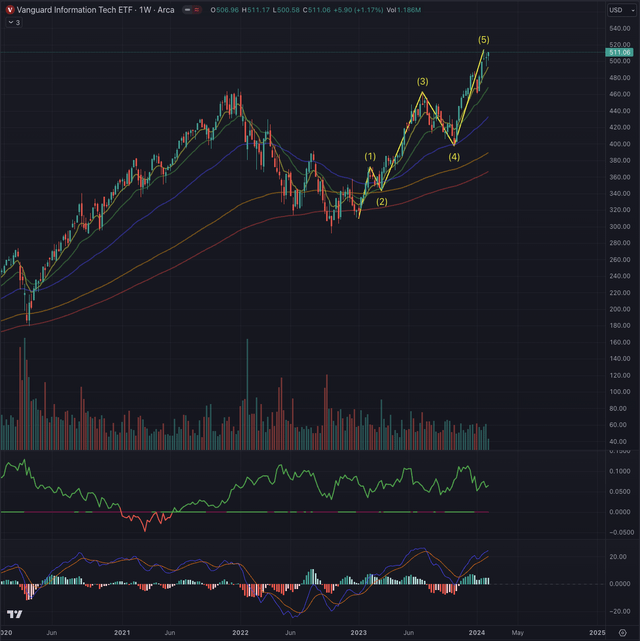
From a global standpoint, consumer sentiment remains below the 100 mark in major economies, facing challenges in substantial recovery following the decline during the pandemic and the subsequent prolonged period of elevated inflation. As highlighted in my recent article, China’s consumer sentiment is notably subdued, prompting authorities to implement substantial measures to stimulate growth and stabilize the declining equity market, which is currently at multi-year lows. The reliance of numerous industries on a robust Chinese economy has been evident since the pandemic, with sectors such as consumer discretionary, particularly electronics and energy companies, experiencing the most significant impacts.
OECD Data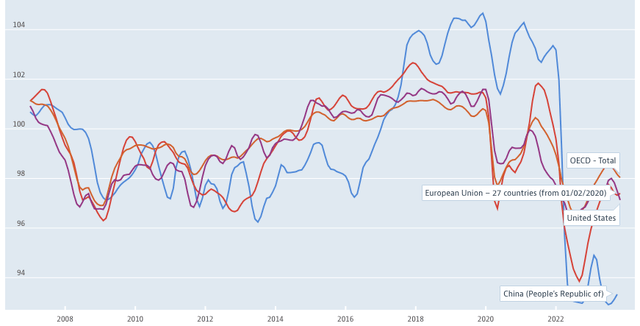
The market sentiment has shifted from a previously very optimistic outlook, which anticipated six interest rate cuts throughout the current year. Expectations have now pivoted towards a less dovish stance, beginning at the FOMC meeting in May, with the possibility of a pause in rate adjustments at the November meeting. This still optimistic outlook, though not universally embraced, poses a particular risk to extended technology stocks, as they could face significant declines if these expectations are not realized. Prolonged periods of higher interest rates have the potential to impact valuation models significantly.
CME Group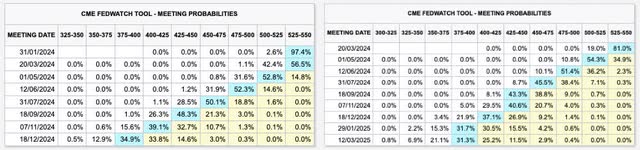
Where are we now?
On December 14, 2023, AAPL achieved a new ATH, marking a double top with its peak from July 2023 and concluding a five-wave impulse sequence the stock initiated at the start of the year. The ascent mirrored that of many technology firms, characterized by a sharp and sustained climb, reflecting a highly favorable equity environment and a strong probability of a smooth landing for the US economy. These assumptions, buoyed by some support from previous economic data releases, nevertheless leave minimal room for negative surprises, potentially exposing the market to heightened vulnerability.
Author, using TradingView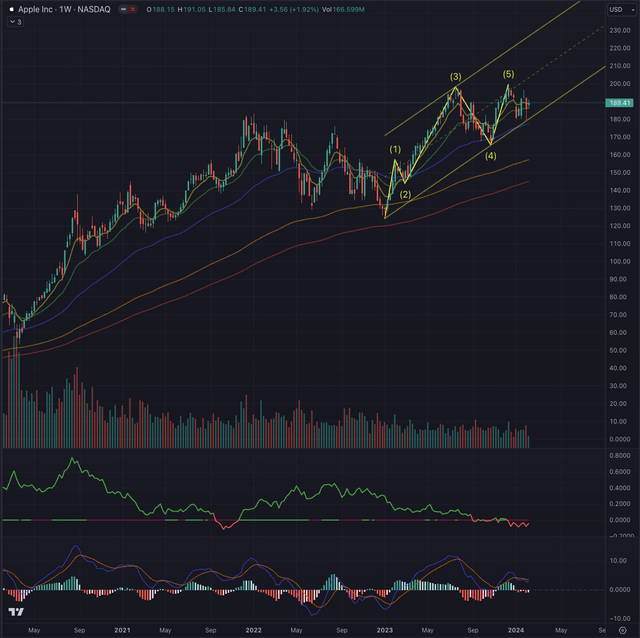
The present evaluation of AAPL indicates a probable consolidation phase characterized by a gradual decrease in buying interest, a flattening momentum, and comparative weakness relative to the broader technology market. While these insights were derived from AAPL’s weekly chart, it’s crucial to zoom in and validate these observations on the daily chart. This closer examination of the daily timeframe will be instrumental in fine-tuning and deciding the subsequent steps for my thesis.
What is coming next?
On AAPL’s daily chart, the consolidation phase becomes even more pronounced. The stock exhibits a triangle formation with progressively diminishing waves accompanied by lower highs and higher lows. Since reaching its ATH, AAPL has underperformed compared to the broader technology market, as represented by the Nasdaq Composite (IXIC). Notably, AAPL has consistently found support at the ascending trendline during more substantial distribution days, indicating resilience amid selling pressure.
Author, using TradingView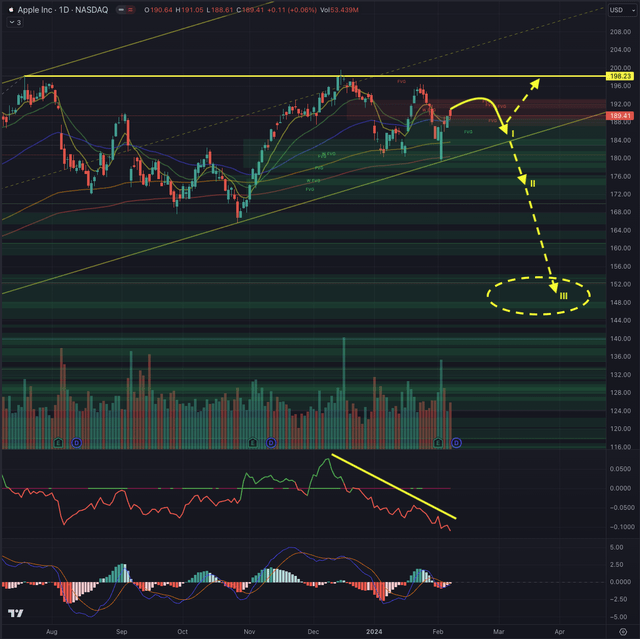
While there’s potential for AAPL to break through overhead resistance, potentially reaching a technical target I estimate at $218, the likelihood of a drop below its supporting trendline appears more plausible. In such a scenario, AAPL could find support at the weekly Fair Value Gaps [FVG] around $175 before encountering further potential weakness. In a worst-case scenario that I define, the stock could decline to a range between $152 and $145. This outcome could be triggered by a broader market downturn, particularly in the overheated technology sector, where only a few large capitalizations resist a broader weakness. Currently, only 57% of US stocks are trading above their 200-day moving average, and merely 48% are above their 50-day moving average. Market breadth has notably declined from its peak at the end of 2023 when 68% of stocks were trading above their 200-day moving average, and over 86% had surpassed their 50-day moving average, a level not observed since February 2021.
For both short and long-term investors, the current situation calls for caution. While AAPL appears to be navigating relatively calm waters, circumstances could shift swiftly, catching both short and long positions off guard. In such uncertain times, it’s wise to await clearer signals before taking significant actions. Setting buy orders above the ATH could capture potential further upside if AAPL continues its ascent. Conversely, as a shareholder, setting stop-loss orders slightly below the ascending trendline while monitoring the stock’s movements closely could help manage downside risk. If AAPL does retreat to the discussed price levels, investors might consider scaling into positions, provided underlying market conditions remain favorable.
In my article published on November 22, 2022, I established AAPL’s price target at $202 based on fundamental analysis. This target closely aligns with the reached ATH at $199.62, indicating that the target has been met. Considering current observations and the realization that both AAPL and the industry benchmark have attained significant targets and are extended, a retracement appears likely. Thus, at least partially, it may be prudent to realize profits at this juncture. Despite AAPL’s strong positioning in secular growth trends, the current stock price reflects a highly optimistic environment. From a technical standpoint, I am downgrading AAPL to a hold position.
The bottom line
Technical analysis serves as a valuable tool for investors, offering guidance rather than absolute certainty, thereby enhancing their chances of success in the stock market. It acts as a navigational aid in the complexities of market dynamics, comparable to consulting a map or using GPS for an unfamiliar journey. By incorporating techniques rooted in the Elliott Wave Theory and leveraging Fibonacci’s principles, I assess likely outcomes based on probabilities. These methods help confirm or refute potential entry points, considering factors such as sector, industry, and, most importantly, price action. My technical analysis aims to scrutinize an asset’s situation and calculate probable outcomes based on these theories, providing a structured framework for decision-making in the ever-changing landscape of the stock market.
The US technology sector has shown robust performance over the past year, particularly in the last month, contrasting with weaknesses in other sectors like energy and real estate. However, signs of a slowdown in consumer electronics and the shift in market sentiment towards less dovish outlooks pose risks. Additionally, AAPL recently achieved a new ATH, but its consolidation phase suggests caution. While potential targets exist for further upside, there’s a higher likelihood of a retracement towards support levels, especially amid broader market uncertainties. For short- and long-term investors, a cautious approach is advisable, considering setting stop-loss orders and scaling into positions based on market conditions. In conclusion, while AAPL’s fundamental strength remains, its technical outlook suggests a hold position at this juncture.
Credit: Source link