

Maxxa_Satori
Omega Healthcare Investors, Inc. (NYSE:OHI) is expected to report its Q4 earnings after-hours on Wednesday, February 7th. Analysts expect the company to report Funds From Operations [FFO] per share of 32 cents on the back of $207.21 million in revenue.
My most recent coverage of Omega Healthcare was in August 2023 when I rated the stock a “Buy” on its high yield and industry outlook. Since then, the stock has lost about 5.50% (including dividends) against the market’s 9% gain. That’s significant under-performance. Will this underperformance continue in the new year or will the upcoming Q4 report act as a catalyst for Omega Healthcare’s stock to turn around? Let’s find out.
OHI Q4 Preview (Seekingalpha.com)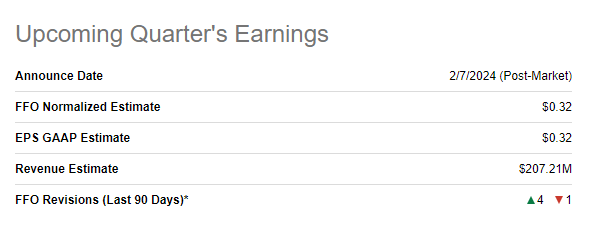
Fairly Low Expectations
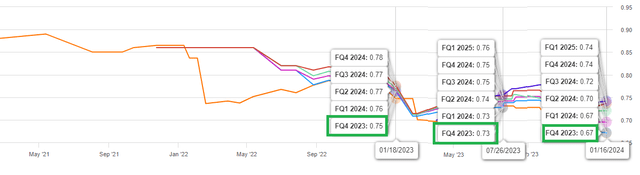
It is safe to say Omega Healthcare is heading into its Q4 report with fairly low expectations. 4/5 EPS revisions and 4/5 revenue revisions have been to the downside over the last 90 days. Should Omega meet the estimates, it’d represent a YoY decline of 56% on FFO and a revenue jump of nearly 100%. Those are some wild swings, indicative of the company still adjusting to macro conditions including post-COVID recovery and interest rates. Not to mention the adjustment Omega made in Q4 2022 placing a few operators on a cash basis for revenue recognition, which impacted its revenue.
OHI Q4 Revisions Count (Seekingalpha.com) OHI Q4 FFO Trend (Seekingalpha.com)
Beat Or Miss? Impressive FFO Streak In Danger
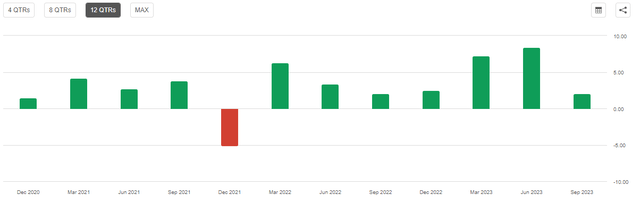
Omega Healthcare is on a hot streak when it comes to FFO as it has beaten estimates 7 quarters in a row. Stretching to the last 16 quarters, Omega has beaten FFO estimates an impressive 15 times. Revenue, on the other hand, has beaten estimates just twice in the last eight quarters.
I expect OHI to miss on its revenue once again as the company has already indicated (covered below) that it expects about $7.5 million less in rent for November and December. That also puts the FFO streak in danger and a beat or meet on FFO will likely come down to whether the company sold any facilities for a gain.
OHI Earnings Surprise (Seekingalpha.com) OHI EPS Streak (Seekingalpha.com)
What To Watch For?
- While Omega has already declared its quarterly dividend, the company recently guided that its Q4’s Funds Available for Distribution [FAD] will be less than its dividend commitment as two operators (Maplewood and Lavie) were expected to pay less than their contractual rent in November and December. That means, based on total shares outstanding of 245 million, we can expect Q4’s FAD to come in below $164 million. If you are wondering what FAD is, think of it as free cash flow [FCF] substitute for REITs.
- Omega’s occupancy rate has been inching up slowly but surely over the last several quarters, consolidating the post-COVID recovery. Omega reports occupancy rate a quarter behind, meaning when the company reports Q4 earnings, we can expect to see the occupancy rate reported for Q3, September 2023. It will be interesting to see if the streak continues and if occupancy inches to or slightly above 80%.
OHI Occupancy Rates (Author, with data from omegahealthcare.com)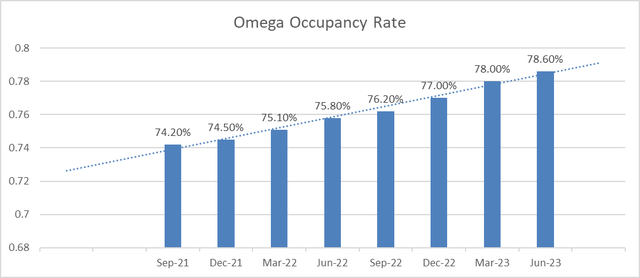
- Shares outstanding has gone up by nearly 20% in the last 5 years with the company issuing 4 million new shares in Q3. I won’t be surprised if the company had issued more shares in Q4 to raise money as the company already carried nearly $5 billion in net debt at the end of Q3 and is struggling with cash flow as explained above.
Valuation
- OHI is undoubtedly cheap on paper heading into Q4 report. The stock’s current yield of 9.24% is handily above the 5-year average of 8.21% while trading at a forward multiple (based on Funds From Operations) of 10.55. No wonder, OHI gets a favorable “A” from Seeking Alpha on its valuation.
OHI Valuation Grade (Seekingalpha.com)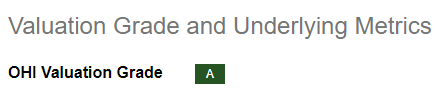
- The 14 analysts covering OHI have a median 12-month price target of $32, which represents nearly 20% upside if you factor in the dividend as well. But is the dividend safe? I have my doubts as explained below. Needless to say, if the dividend is cut, OHI’s stock will lose almost all its luster and is likely to lose further ground.
Technical Indicators
OHI is going into Q4 earnings on a weak technical base as the stock is trading below all the commonly used moving averages. The 100- and 200-Day moving averages are 10% and 7% higher than the current market price. In addition, except the 200-Day moving average, each of the average below is progressively lower, meaning the stock is clearly on a downtrend. OHI will need a significantly positive Q4 report to reverse this downtrend and I am not too positive about getting one.
OHI Moving Avgs (Barchart.com)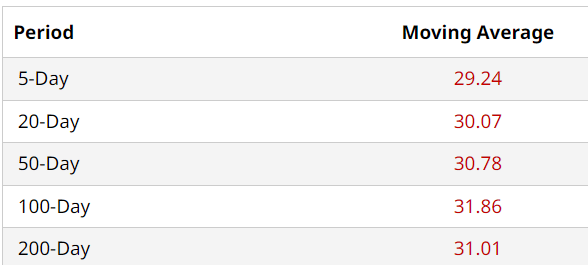
Conclusion
Basic math is still in favor of OHI and its investors as I explained in my August review. However, business and macro reality can easily throw these numbers out of the equation. For example, rate cuts may not materialize at least until May, Omega’s occupancy rates have not reached pre-COVID levels, and the company’s existing operators are dealing with their own struggles. All these factors force me to downgrade OHI to a “Hold” heading into Q4, although I still believe the long-term care industry will continue thriving in the U.S given the demographics.
Last but certainly not the least, Seeking Alpha’s sell recommendations have a proven track record of significantly underperforming the market and I feel compelled to call out that OHI has plenty of bad grades as shown below. For example, the payout ratio being at 97% is scary to put it mildly, before you even factor in the rent misses like with Maplewood and Lavie. Even if you don’t believe the dividend is in danger, I believe better buying opportunities may present themselves after Q4 report.
OHI Grades (Seekingalpha.com)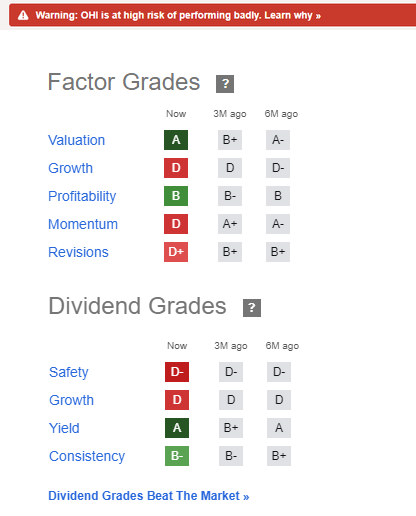
Credit: Source link