
Ethan Miller
Since the release of Q3 results, Luminar Technologies (NASDAQ:LAZR) share price has experienced a 26% decline. What drives this trend? Are the current revenue expectations inadequate to reverse the downward trajectory? What risks does the company face if, by the end of 2024, it needs more cash to navigate through 2025? Will selling more equity be the solution since the company sold $62M in the first nine months of 2023? Could today’s market cap of $1B significantly diminish if vital indicators remain unmet?
Key Performing Indicators
As the company updates its order book, I assert – consistent with my perspective – that Luminar’s success hinges on three closely intertwined factors, two connected to the income statement and one to the cash flow statement.
These three key performance indicators are revenue, gross margin, and operating cash flow. In contrast to operating expenses or OPEX, which encompass numerous non-cash items, I utilize operating cash flow to understand how the company spends its cash and how much it will have left. Revenue, inherently positive, lacks supportive value without a positive gross margin. Thus, the gross margin assumes importance in aiding Luminar’s navigation through 2024 and 2025, the anticipated year of break-even according to the company’s projections. In fairness to Luminar, the uncertainty surrounding the gross margin outcome 2024 is compounded by the need for extensive prior production experience on a large scale.
Moving to the next factor, operating cash flow has presented a trend indicative of significant spending. However, the company suggests that it can be curtailed. The degree of these reductions will be a focal point for the market during the Q4 results, where the company is expected to update on these factors. In the presentation made for Q3, CFO statements offered the following on the topic:
We continue to believe our cash and liquidity position is more than required to execute on our current plan for profitability. Our Q4’23 Free cash flow exit rate target and our YE’23 Cash and liquidity guidance imply at least two years of runway, which should be sufficient to get us to our current targeted profitability by YE’25.”
And importantly:
We continue to expect to reduce our Free cash flow[3] by approximately 50% by year-end relative to Q1/Q2 levels. Specifically, we expect Q4 operating cash flow in the range of $(30)M-$(35)M and Free cash flow, measured as Operating cash flow less CapEx, in the range of $(35)M-$(40)M. We expect the improvement in FCF will be driven by the ongoing reduction of launch-related expenses[4] as our high volume facility and production ramps up. We experienced improving FCF on a monthly basis through Q3, and we are seeing further signs of improvement early in Q4.”
In the most recent quarter, Luminar reported $16.9M in revenue, with a cost of sales totaling $35M – essentially yielding the negative 107% gross margin. Notably, the product gross margin was negative 156%. During Q3, the company incurred $56M in net cash used in operating activities or operating cash flow, reflecting a 14% improvement from an average of $64M per quarter from the total $194M spent in the year. The expected operating cash flow of $30 to $35M will dramatically improve from current results.
Before moving to commentary on revenue, below is the slide from the presentation, which is almost a year old. The slide offers some form of predictability for 2024 by suggesting that the core business will break even this year, explaining that the Core Business Break-Even refers to the target of reaching operating profit break-even for our core Lidar hardware and component businesses and excludes investments in software, insurance, and our future product roadmap.
Luminar Investors’ Day Profitability Roadmap (Luminar Technologies)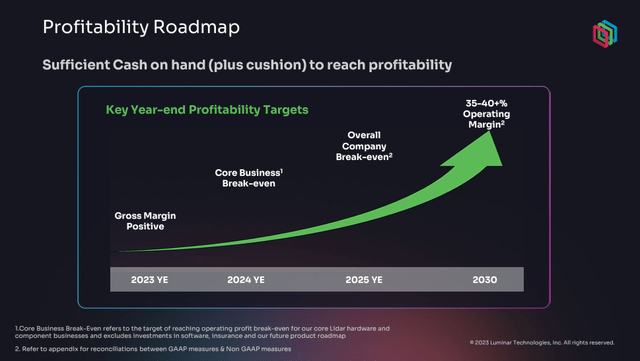
The operating profit equals revenue minus COGS or cost of sales minus operating expenses. For the YTD for Luminar, this math looks like in thousands of dollars:
Revenue – COGS – OPEX = Operating profit (loss)
$47,665 – $98,784 – $363,597 = -$414,716
To break even for 2023 YTD results, Luminar would have to turn the loss of $414M into a zero. If the revenue for 2024 is expected to be $185M, the total cost of COGS and OPEX would have to be $185M to result in zero. Based on the Q3 statement about operating cash flow, I am going to replace OPEX with it in this equation:
$185M – X – $120M = 0 for $30M per quarter or
$185M – X – $140M = 0 for $35M per quarter.
It means that COGS would have been $65M in the first scenario and $45M in the second scenario. Therefore, The gross margin would have to be 64% in the first scenario and 78% in the second scenario, which is impossible. In my opinion, the slide from February 2023 no longer reflects the business at hand, likely because of the massive reduction in the revenue forecasts. What is found on the slide for 2025 and beyond will also require adjustment.
Revenue Risk
As mentioned earlier, in 2024, analysts’ views collected by SA see an estimated $185.4M, and these projections mark a notable shift from the mid-2023 forecast of $277M. There may also be risks with this forecast based on the situation of two primary sources, Volvo (OTCPK:VOLAF) and Polestar (PSNY).
A quick review of Polestar results indicates that the company sold 56K cars, including 880 Polestar 4s produced in Q4 in China, which would be optional for Iris sensor installation. All eligible vehicles, 3, 4, and 5, would be new for 2024. The same is true for the Volvo EX90, which is planned to replace the XC90 eventually with a new production set for 2024. The ICE model sold 107K in 2023.
If Luminar repeated 2023 revenues of $75M in 2024, additional sensor sales would have to be $110M, with the price range of $1000 per sensor, giving a need for no less than 110K cars. Right there, the number of vehicles between Polestar and Volvo that have the opportunity to install Iris is nowhere near that volume. So, revenue expectations of $185M seem to be at risk, even if we add Gatik and Kodiak Robotics buys.
Operating Cash Flow and Revenue Scenarios
My analysis offers four models of operating cash flow: $30M per quarter (guided), $35M (guided), $40M, and $50M. Reminder: operating cash flow is net cash used in operating activities. Those run at three levels of revenue for 2024 and 2025. The first set is the current estimates; the other two are mine.
My gross margin calculation sees a 2024 178% improvement, driving Luminar results from negative 107% to positive 20% in the best setting for 2024. Luminar’s expectation for 2025 is to see a gross margin of 35%. I am using it as the final range for 2025 scenarios.
The expectation is that every time the cash at the end of the year is less than the operating cash flow for the year, I expect an equity sale. I have identified those as having the “salmon” color under Cash EoY. The scenario is a success only when it spans two years.
$50M Quarterly Operating Cash Flow
The $50M quarterly operating profit requires equity sales in all scenarios.
Luminar – Revenue, GM, OCF at $200M (SA, Author)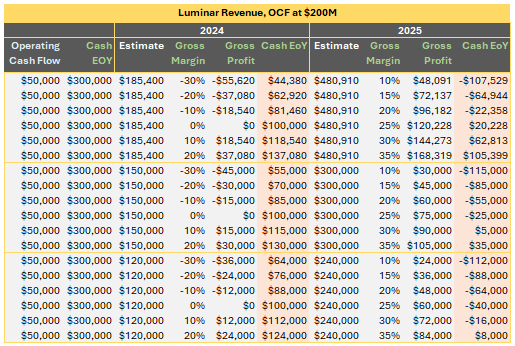
$40M Quarterly Operating Cash Flow
Decreasing the quarterly operating cash flow to $40M has only one favorable scenario in the highest revenue category, with once again the highest gross margins at 20% in 2024.
Luminar – Revenue, GM, OCF at $160M (SA, Author)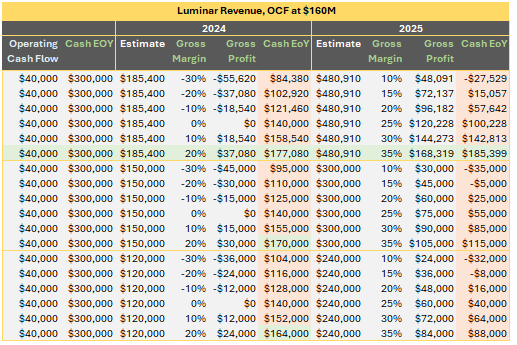
$35M Quarterly Operating Cash Flow (guided)
There are three scenarios within $35M operating cash flow per quarter where equity sale is unnecessary. Two scenarios fall in the highest revenue, starting with a gross margin of 10% in 2024 and 30% in 2025. Those two scenarios see the profitability achieved by Luminar in 2025.
The third one is possible for revenue of $150M in 2024 and $300M in 2025, at gross margins of 20% in 2024.
Luminar – Revenue, GM, OCF at $140M (SA, Author)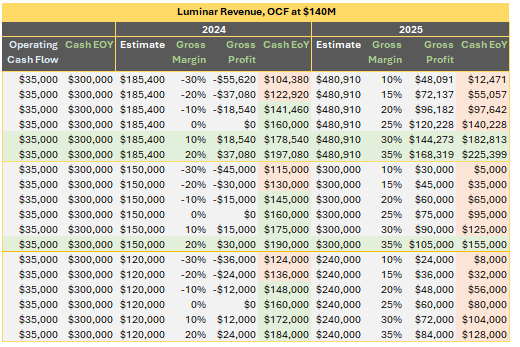
$30M operating cash flow (guided)
The operating cash flow of $30M is the best outcome for Luminar. It can sustain the organization even with a 10% negative gross margin during 2024 in the top revenue scenarios. As revenue gets lowered, the GM has to increase, but even at a GM of zero, Luminar does not appear to need equity sales to support operating cash flow.
Luminar – Revenue, GM, OCF at $120M (SA, Author)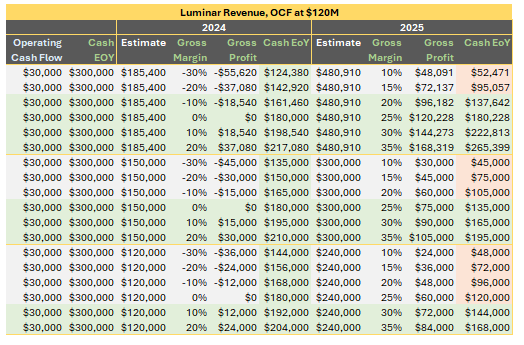
Conclusion
There is excellent awareness regarding the operating cash flow requirements of $30 to $35M on the company’s part. Any other level of spending per quarter would necessitate equity sales to support operations.
It is also clear that the gross margin impact at the $35M range of cash spent requires a minimum of 10% in 2024 to avoid equity sales. Finally, achieving $30M quarterly cash spent can afford a negative rate of 10%, but only at a forecasted revenue of $185M. If revenue dips, there is no room for a negative margin, meaning the operation has to be more efficient to produce a positive margin with less revenue. In all, this makes those scenarios less probable.
To summarize, Luminar may face difficulties if its revenue falls below $185M, its gross margin is negative, and its operating cash flow per quarter or cash used in operating activities goes beyond $30M. The primary concern is that the company needs to generate an additional sale of 110K sensors to meet this year’s revenue forecast of $185M. It will be challenging for a company with no experience to achieve positive gross margins in its first year due to delays and lower manufacturing volumes. Moreover, based on Luminar’s operating record so far, it will be inherently challenging to attain the necessary level of operating cash flow of $30M.
Luminar’s market cap is currently $1B, with a negative equity condition of 41 cents per share and its current cash per share of 75 cents, which is expected to decrease even further. With my view of the three indicators as negative, I anticipate that Luminar will continue to lose value instead of bounce with the Q4 update on 2024 forecasts. How bad or good those indicators turn up will determine the severity.
In August 2023, I gave Luminar a “hold” rating, but the share price has since fallen by 55%. Due to the selloff, the rating seems more appropriate now than before. I’m keeping an open mind to the potential that Luminar may perform better than I predicted, and thus, I will continue to rate it as “hold.” I encourage investors to consider my scenarios and assess what lies ahead for Luminar. Once Q4 updates arrive, I will use predictions offered here against it to determine what investors should do next and update my rating accordingly.
Credit: Source link