

pcess609
Introduction
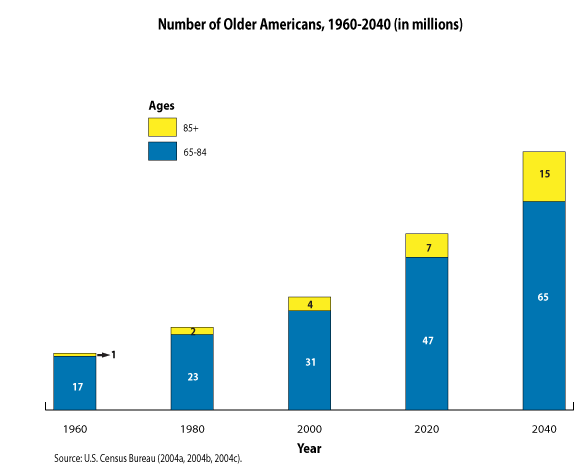
Over the past decade, the iShares U.S. Healthcare ETF (IYH) only trailed the iShares U.S. Technology ETF (IYW) amongst the iShares sector ETFs, granted by a wide margin! Most estimates say 10,000 Baby Boomers enter Medicare each day, with the last of us joining in 2030. As the next chart shows, the number of US citizens over 65 and 85 is scheduled to continue climbing.
Urban Institute
Projections are that Americans ages 65 and older will more than double over the next 40 years, passing 80 million by 2040. Adults ages 85 and older will should quadruple by 2040 from the start of the century.
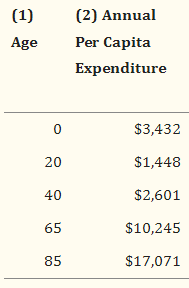
The next table shows that “senior citizens” spend the most per year on medical costs.
NCBI
Even with Congress trying to rein in these costs, demographics point to the Healthcare sector as a good place for above average growth.
In this article, I will review the SPDR S&P Biotech ETF (NYSEARCA:XBI), which I own, and the widely covered CEF, the abrdn Healthcare Opportunities Fund (NYSE:THQ), which includes non-equities in their allocation mix. At least annually, I like comparing my ETFs against others in the same or a closely related sector. While XBI has a narrow focus, THQ spreads it assets across Healthcare, including fixed income assets from those issuers.
After this comparison, I decided to maintain my SPDR S&P Biotech ETF exposure. It gets a Buy rating for investors liking this Healthcare sub-sector, while THQ gets a Hold rating.
SPDR S&P Biotech ETF review
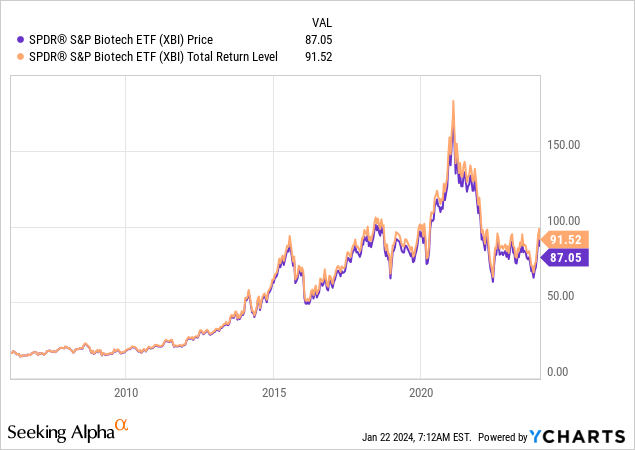
Seeking Alpha describes this ETF as:
The SPDR S&P Biotech ETF is an exchange traded fund launched by State Street Global Advisors, Inc. The fund is managed by SSGA Funds Management, Inc. It invests in public equity markets of the United States. It invests in stocks of companies operating across health care, pharmaceuticals, biotechnology and life sciences sectors. The fund invests in growth and value stocks of companies across diversified market capitalization. It seeks to track the performance of the S&P Biotechnology Select Industry Index. The ETF started in 2006.
Source: seekingalpha.com XBI
XBI has $6.8b in AUM and has a 35bps fee cost. The yield is only .02%.
Index review
Since the manager isn’t selecting and weighting the ETF’s holdings, understanding the index rules that do is a critical part of the required due diligence. S&P defines their Index as:
S&P Select Industry Indices are designed to measure the performance of narrow GICS® sub-industries. The S&P Biotechnology Select Industry Index comprises stocks in the S&P Total Market Index that are classified in the GICS Biotechnology sub-industry.
Source: spglobal.com
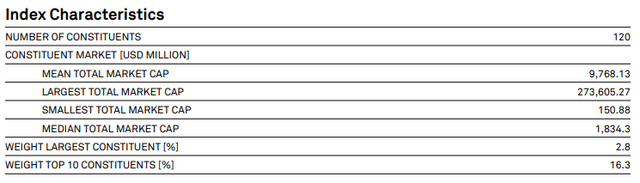
Basic index characteristics include:
S&P Global Biotech Index
The accompanying Methodology PDF provides the important details, of which I deemed these worth listing.
- Stock is included in the S&P Total Market Index
- Company classified under GICS 3520, a sub-sector under Healthcare
- Minimum market-cap of $300m to $500m based on the liquidity of the stock
- At each quarterly rebalance, index components are weighted by their float-adjusted market capitalization
- There are also maximum weight rules so no individual or group exceeds set limits (22.5% for one stock). With 120+ stocks, these should not effect this index
XBI holdings review
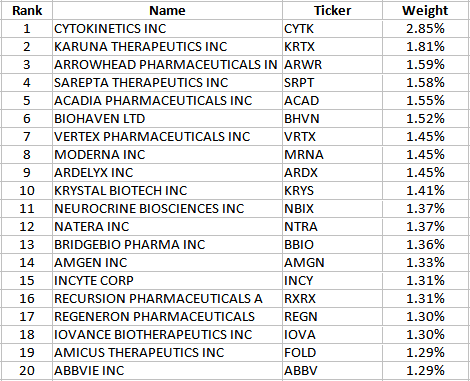
SSGA XBI holdings
The Top 20 positions account for almost 30% of the total portfolio, out of 125 stocks held. The lower half of the portfolio represents just over 23%, what I would consider a respectable level considering the index is weighted by each stock’s floated-adjusted market-cap.
XBI distributions review
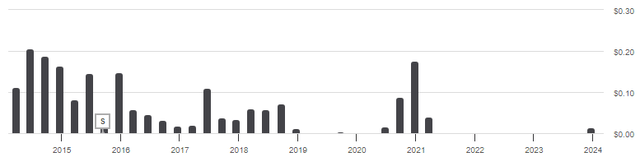
SeekingAlpha XBI DVDs
Even at its height back when it started, the yield seldom broke 1%. The nice thing now is investors are not getting much, if any, taxable income each year.
My previous review on XBI is worth reading (article link) as it goes into more depth why I think biotech has a strong future even if results haven’t shown it since 2019. That said, biotechnology proved its potential with it rapid development of the various COVID vaccines. Not sure how the Sell rating got attracted to the article since I advocating buying XBI for biotech exposure.
abrdn Healthcare Opportunities Fund review
Seeking Alpha describes this CEF as:
Abrdn Healthcare Opportunities Fund is a closed ended balanced mutual fund launched and managed by abrdn Inc. The fund invests in public equity and fixed income markets across the globe. It seeks to invest in securities of companies operating in the healthcare sector. The fund also invests in pooled investment vehicles. For its fixed income portion, the fund invests in corporate debt securities across the credit rating spectrum. The CEF started in 2014.
Source: SeekingAlpha THQ
THQ has $1.04b in AUM, including the $225m in preferred assets for a leverage ratio of 20%. Total fees are 295bps, with leveraging costs being half of that. The current yield is 7.3%. The previous manager, Tekla, sold this and three other CEFs to abrdn at the end of October so that could affect future results, though the same people are running the CEFs (news release).
The managers provided reasons for investors to own this CEF, some will sound familiar:
• Aging demographics and adoption of new medical products and services can provide long-term tailwinds for healthcare companies
• Late-stage biotechnology and pharma product pipeline could lead to significant increases in biotechnology sales
• Investment opportunity spans 11 sub-sectors including biotechnology, healthcare technology, managed care and healthcare REITs
• Robust M&A activity in healthcare may create additional investment opportunities
THQ holdings review
Seeking Alpha had the most recent holdings and that was for 11/30/23.
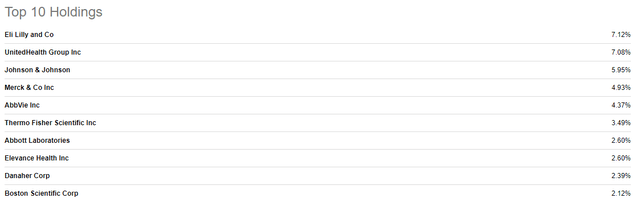
SeekingAlpha THQ holdings
Despite holding roughly the same number of total holdings, the Top 10, here at 42%, is more than the Top 20 held by XBI. The names reflect the fact mentioned later that this CEF has a large-cap focus. While a bit dated, having sub-sector allocations is still useful.
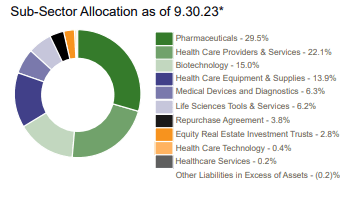
abrdn THQ
The table also shows why some would call this an apples-to-oranges comparison as XBI focuses on one sub-sector, Biotechnology. The title explains the “why”.
Running a Healthcare fund as a pseudo Balanced Fund was interesting discovery. If the strategy was reducing the fund’s StdDev without distracting from the return achieve, that worked. I have to assume income generation was another strategy goal and I say that failed since, as shown next, little of the payouts comes from investment income.
Another view on their use of leverage it basically is funding their fixed income exposure. With recent leveraging costs, the net return from those assets might be negative, essentially if a large percent of those assets are low-yielding convertibles.
THQ distributions review
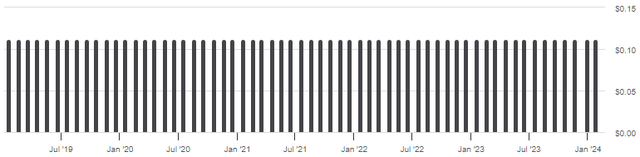
SeekingAlpha THQ DVDs
THQ uses a managed distribution policy where the Board of Trustees set a monthly distribution rate. Data I saw back to 2014 also had monthly payments of $.1125 as is the latest payment: makes the BOT decision very easy it appears. The last special payment was made in 2015. As one might suspect, that does mean non-income sources might be required to maintain the level payout and indeed that is the case. In 2022, only $.18 of the $1.35 came from income, the rest from other sources, including various amounts of ROC.
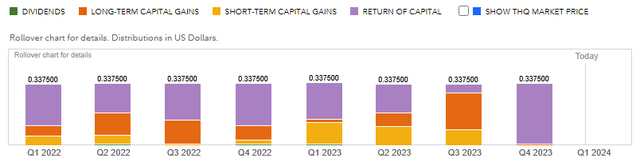
Fidelity
The 11/30/23 report showed payouts were funded entirely from ROC. So while THQ shows a hefty 7.3% yield, much comes from giving the investor either their own funds or requiring the CEF to buy/sell to capture gains to distribute, which is an inefficient way to manage an equity fund in my view.
Comparing the funds
| Factor | XBI ETF | THQ CEF |
| AUM | $6.8b | $1.04b |
| Fees | 35bps | 295bps |
| Yield | .02% | 7.3% |
| EQ/FI/Cash Pcts | 99.9/0/.1% | 100/16.4/1.9% |
| Exposure | Biotechnology | 11 Healthcare sectors |
| Assets held | 125 | 120 |
| Top 10 Pct | 17% | 43% |
| Turnover Pct | 65% | 44% |
I used Morningstar to get valuation data.
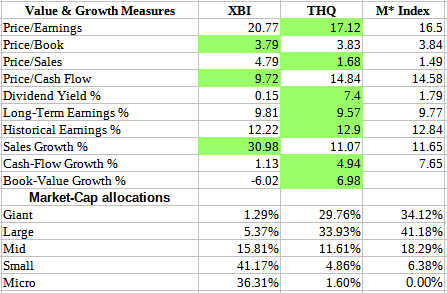
Morningstar; compiled by Author
While I shaded the better value in Green, many differences are small. Where these two fund really differ is in the stocks held when looked at by market-cap; they are near opposites in their allocations. The average market-cap for THQ is $106b, compared to just $4.3b for XBI. Regardless of other factors, how an investor feels about going-forward returns by market-cap will be high on their evaluation list.
At this point, I normally do a complete fund holdings comparison but none of the tools I found would accept a CEF.
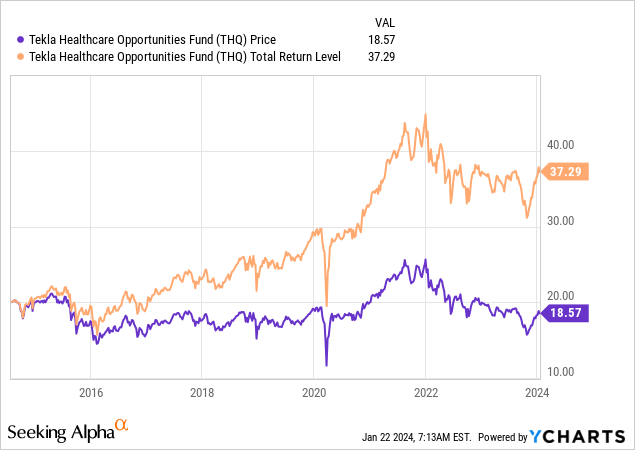
Despite their different approaches, the results investors saw were very close since 2014, but with periods where there were wide variations.
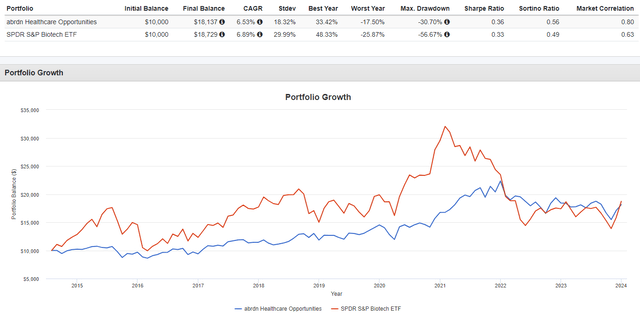
Portfolio Visualizer
For investors who chose not to reinvest into either fund, that hurt THQ investors more, making XBI the better investment.
My conclusion
I give XBI a Buy rating, THQ a hold for these reasons:
- I have a personal preference for a more focused fund in the Healthcare sector. XBI has a narrow biotech (and minor Pharma) one, whereas THQ has exposure to 11 sub-sectors.
- It has been my experience that funds with multiple goals like I feel THQ has, neither strategy is optimized.
- While THQ provides a high yield, they have to sell winners to make much of those payments. Related, that isn’t why I want Healthcare exposure.
- THQ’s use of leverage is costly and not enhancing the return investors see. That said, THQ currently trades at a 13+% discount.
Forward looking
One risk of a biotechnology focus, especially small-cap stocks, is some are heavily dependent on limited pipeline of drugs/vaccines, where a single failure can have devastating results. That same fact can results in large gains if successful or a larger firm offers a merger opportunity. It is that risk factor, plus the difficulty in picking winners in the sub-sector that has me favoring the use of a fund, including one like XBI that invests based on an index. I like the reasonable P/E ratio compared to the holdings historical earnings growth, resulting in a 1.5x PEG ratio.
Portfolio strategy
I look to sector funds when my overall equity allocations show underweighting by a margin I want to reduce. Along with XBI, I hold the iShares U.S. Medical Devices ETF (IHI). For the same reason, I added the iShares U.S. Technology ETF (IYW). As the two funds reviewed here, there even sub-sector funds to narrow one’s allocation with as even within a sector, results can vary widely. With fees coming down, using ETFs in place of stock selection becomes less costly.
Because of their difference investment strategies, owning both, even adding the IHI ETF, which outperformed either of those reviewed, would cause little holdings overlap and can add focus to either biotechnology or medical devices within the wider Healthcare sector. Great to have those options.
Final thought
One of the things I like about contributing to Seeking Alpha it means being on the site almost daily, which exposes me to useful investment advice to consider. Also, like those I’m about to list, others view on funds or sectors I have or am considering adding exposure to. These two articles compliment mine nicely.
- Healthcare In 2024: Navigating The Biopharma Bull Run
- THW: abrdn Takes Over, Fund Drops To Massive Discount, But THQ Still Looking Better
One of the biggest values I see and get from my Seeking Alpha subscription is reading what others are saying, especially when going into depth about a particular sector or sub-sector, where my knowledge always can use expanding.
Credit: Source link