

Paul Panayiotou/Corbis Documentary via Getty Images
We are hardly the first ones to point this out, but UK stocks are looking very cheap, especially when compared to current valuations in the United States. Still, when we look under the hood, we don’t particularly like what we see. There are a lot of stagnant financial companies, cyclical companies in the mining and oil sectors, and other companies that we don’t think have much growth potential. That said, when looking at small and mid-cap companies, we find slightly higher valuations, but a lot more growth potential.
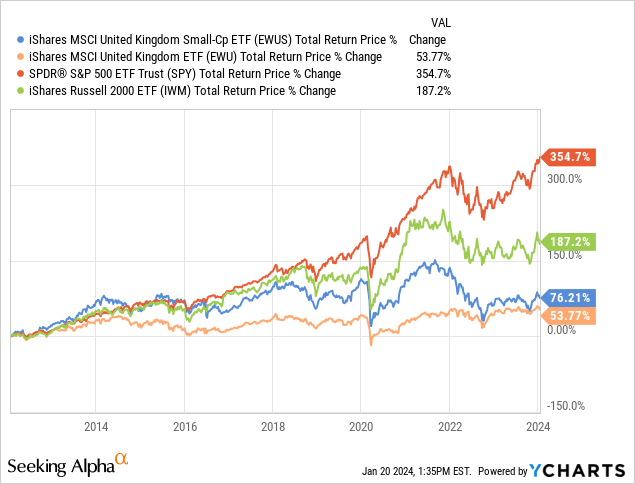
It is difficult to describe the underperformance of the UK market in the last few years, so we will add a chart showing how the S&P 500 Index (SPY) has trounced the MSCI United Kingdom Index (NYSEARCA:EWU). British small caps have outperformed their larger peers, with the iShares United Kingdom Small-cap ETF (BATS:EWUS) outperforming EWU by more than 20% on a total return basis. Still, the iShares Russell 2000 ETF (IWM) has outperformed EWUS by an enormous margin. Despite the UK’s economic and political issues, we believe this underperformance warrants further investigation to see if there is a potential opportunity, or if current valuations in the UK are warranted.
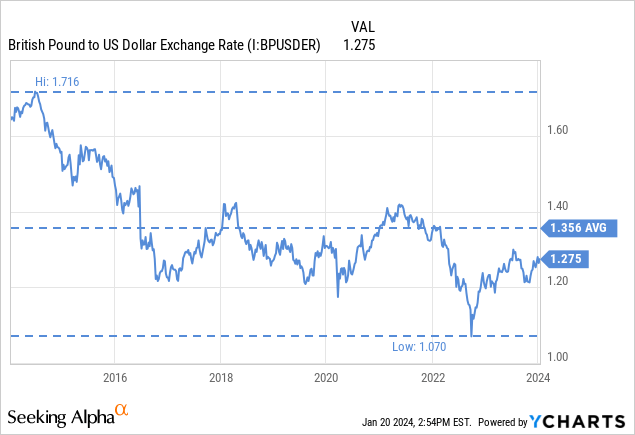
The British Pound
One headwind for international investors in the UK market has been the British pound, which has lost significant value in the past decade. This has had a bigger impact on small and mid-cap companies that make most of their revenue and earnings in the country, while it has had some benefits for international large cap companies that have significant costs in the UK, but a large share of their revenue is earned in other currencies.
Portfolio Characteristics
The price/earnings ratio for EWU looks like a bargain at 10.32x, which, when inverting, results in an earnings yield of almost 10%. In other words, the UK market appears to be priced for no growth, as it could deliver a very solid return even with minimal growth. It is important to mention that iShares calculates the P/E ratio excluding negative ratios, and it is not clear how many companies in the ETF are operating at a loss. Still, looking at the dividend yield and price/book ratio, it is clear that UK stocks are trading at a low valuation.
iShares.com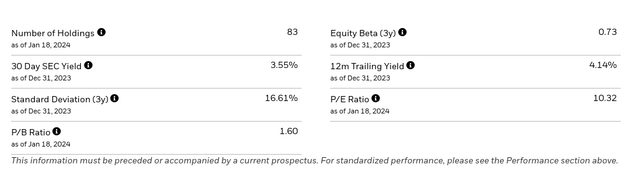
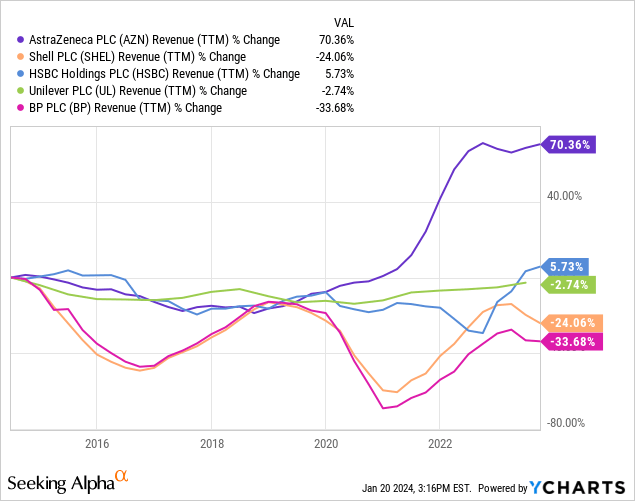
Taking a look under the hood, we see that the ETF is highly concentrated in the top five positions, which together account for about a third of the total. These companies are AstraZeneca (AZN), Shell (SHEL), HSBC (HSBC), Unilever (UL), and BP (BP).
iShares.com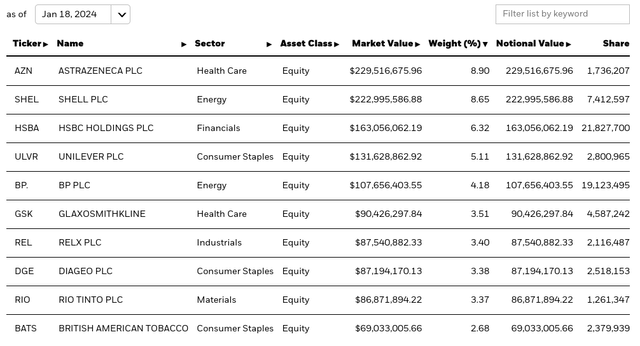
Of these five, the only one that has really grown its revenue significantly is AstraZeneca, HSBC and Unilever have been basically stagnant, and Shell and BP are bringing in much lower revenues. This is a good representation of what is going on with UK stocks, and why investors have been unwilling to pay higher valuation multiples.
Still, when investors avoid a country or sector, sometimes they are not very discerning, leaving some good opportunities behind. AstraZeneca is a good example, where the company is expected to continue growing its sales and earnings at a rapid pace, and it is trading at a reasonable P/E multiple. Earnings are expected to grow so quickly, that the FY25 estimated P/E ratio is only around 12x. Still higher than the average for EWU, but we would argue this company is much higher quality than the average holding.
Seeking Alpha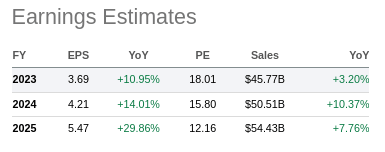
Looking at the portfolio characteristics of EWUS, the ETF focused on UK small and mid-cap companies, we see that the average valuation is somewhat higher when measured using the P/E ratio, but actually slightly lower when looking at the price/book ratio. The dividend yield is lower, but this is hardly surprising, as small companies tend to retain a larger percentage of their earnings to fund growth opportunities.
iShares.com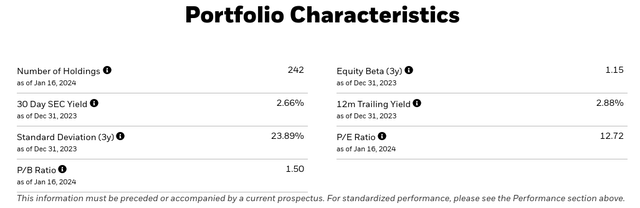
This ETF is more widely diversified, with the top five position representing only about 8% of the value. We will take a look at the revenue growth of the biggest positions as we did for EWU, to get an idea of how they compared to their larger peers.
iShares.com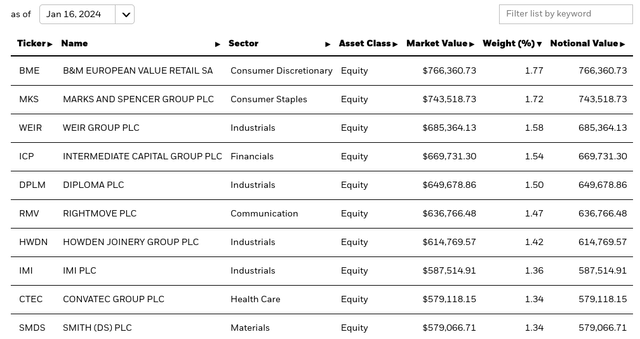
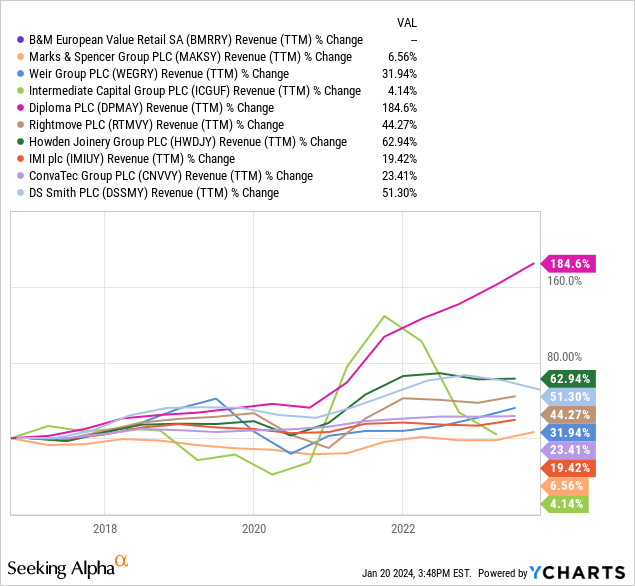
Here we are adding the top ten positions to compensate for the fact that the top positions represent a smaller percentage of the ETF. While not every company has delivered meaningful growth, we see that the average growth is clearly higher. Some notable examples include Diploma (OTCPK:DPMAY), Rightmove (OTCPK:RTMVY), Howden Joinery Group (OTCPK:HWDJY), and DS Smith (OTCPK:DSSMY).
We believe that the roughly 20% price/earnings multiple premium is warranted given the higher average growth smaller companies are showing. In terms of fees, both are relatively high in our opinion, with EWU having a 0.50% expense ratio and EWUS 0.59%.
Sectors
When looking at the sector weightings, there are some similarities, as well as some important differences. Both EWU and EWUS have a high concentration in financials, as is to be expected given the importance of this industry in the UK, and London specifically.
iShares.com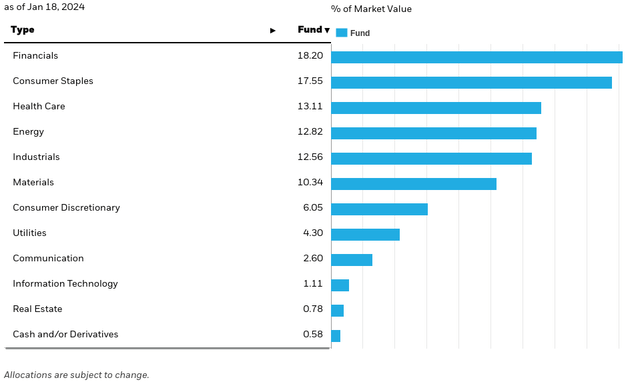
However, cyclical sectors like materials and energy represent a much larger portion for EWU compared to EWUS, with the latter having higher weighting in industrials and technology. Surprisingly, real estate represents less than 1% of AWU’s holdings, while it has a roughly 13% weighting in EWUS. Another interesting difference is the weighting they have for information technology, with EWUS having almost 5x more exposure.
Overall, we think EWUS has a better balance and diversification among different sectors, even if some could argue that EWU is more defensive given the high concentration in consumer staples and health care.
iShares.com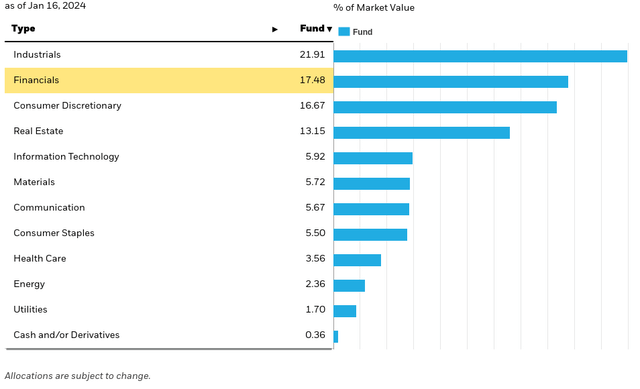
Sustainability Characteristics
Another important difference between EWU and EWUS is their sustainability characteristics. In fact, Morningstar Sustainalytics gives EWU a 2/5 rating, while it gives EWUS a 4/5 rating.
The EWUS ETF has basically no exposure to some of the most controversial sectors, as can be seen below.
iShares.com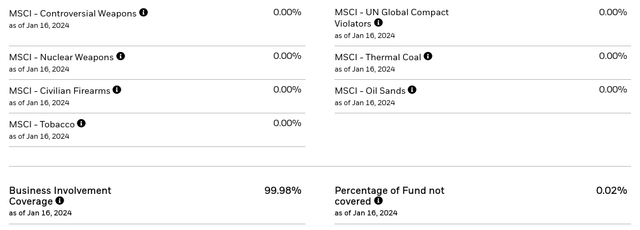
Meanwhile, EWU has some exposure to tobacco, thermal coal, and companies that have failed to comply with the United Nations Global Compact Principles.
iShares.com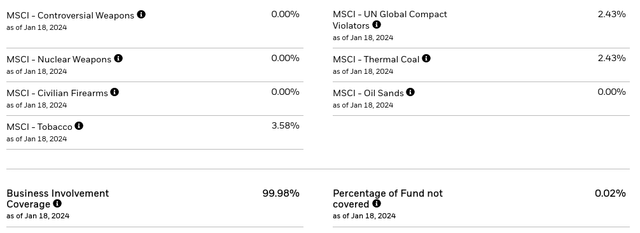
Valuation
As previously noted, the valuation multiples between EWU and EWUS are not that significant, with EWUS trading with a slight price/earnings multiple premium, but a price/book multiple discount. The more important difference is that EWUS appears to have higher growth companies as part of its holdings. We therefore view this ETF as the more attractive option to invest in the UK.
Another benefit is that the small and mid-cap companies that make part of EWUS earn most of their revenue in pounds, and will likely benefit more should the UK’s currency appreciate. According to the OECD’s exchange rate purchasing power parity, the pound should trade at $1.53 per dollar, which implies it is probably about 20% undervalued.
Risks
While the UK is considered a solid developed economy, it has faced significant headwinds and instability in recent years. In particular, following their exit from the European Union.
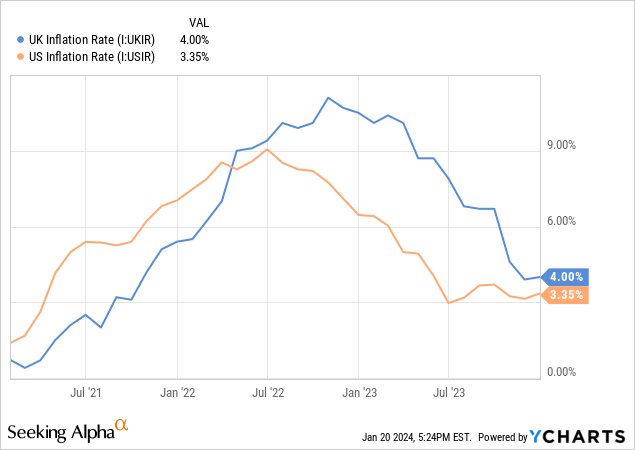
More recently, vulnerabilities in the UK’s financial sector surfaced when the government unveiled a budget that caused investors to panic and government bonds to significantly drop in price. That created a mini-financial crisis that put several pension funds at risk, and which did not stop until the Bank of England intervened. The UK also experienced a sharp increase in inflation, even higher than what was seen in the United States. Further adding uncertainty, the country is having a general election. In other words, the UK is facing significant macroeconomic and political uncertainty at the moment.
Conclusion
After more than a decade of underperformance, there is a case to be made that UK equities are attractively priced. While valuation multiples are indeed quite low, some of the UK’s biggest companies appear to have poor growth prospects. We believe the EWUS ETF, which focuses on smaller companies, is more attractive, and could benefit more if the British Pound recovers to a value closer to purchasing power parity with the dollar. The UK economy is facing significant economic and political uncertainty, but given the low valuation at which EWU and EWUS are trading, it appears a lot is already priced in. As a result, we are giving EWU a ‘Hold’ rating, and EWUS a ‘Buy’ rating.
Editor’s Note: This article discusses one or more securities that do not trade on a major U.S. exchange. Please be aware of the risks associated with these stocks.
Credit: Source link