
SOPA Images/LightRocket via Getty Images
I have wavered between skeptical of its overvaluation in the early years after the 2014 Alibaba Group Holding ADR (NYSE:BABA) IPO, to downright bearish the last couple of years on slowing company growth and Chinese government interference in operations. However, things do change. While I do not count myself as a raging bull on the stock, if you feel you want to participate in China’s economy, diversifying away from a western-market focus, the arguments to own Alibaba are getting much stronger than 6-12 months ago.
YCharts – Alibaba, Weekly Price Changes, Since 2014 U.S. IPO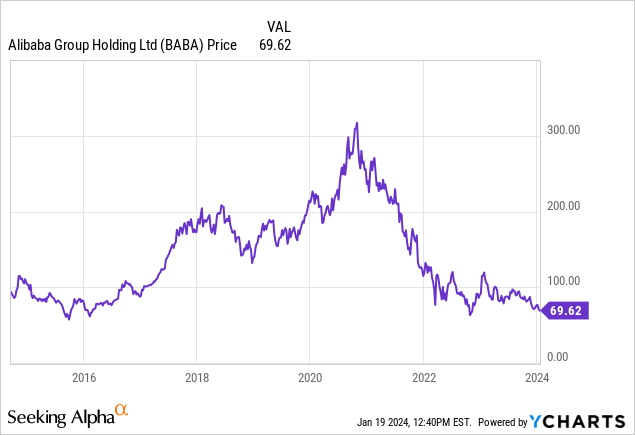
For sure, a number of hurdles including a Chinese economy near recession, the development of new government rules on AI development, questions about accounting differences vs. GAAP U.S. results, to the still tight control on capital flight out of the world’s second-largest economy, will be issues for both company growth and the share price going forward. BABA has been the poster child for how an inexpensive stock can get even cheaper when a string of bad news is piled onto already bearish investor sentiment.
One positive change that has persuaded me to up my rating on Alibaba is the capital return idea. The company received permission in November to pay a dividend to the U.S. and other outside nation shareholders. I have complained that $1 annual payout is not big enough to bring in the income investment crowd, but you have to begin somewhere (1.5% for cash yield as of yesterday). In addition, share buybacks have slightly reduced outstanding counts for several years now.
In the end, if China/U.S. friction calms and this usually introverted nation opens up capital flows and its markets to freer competition, Alibaba could quickly turn into a monster gainer. I know it won’t happen overnight, but institutional-size value investors like Charlie Munger (RIP) have purchased shares since 2021. Today, the value proposition has become quite attractive, especially when you measure results vs. the closest U.S. E-commerce and Big Tech peer business of Amazon (AMZN).
For investors looking to diversify outside U.S.-only asset positioning into Asia, a small position in Alibaba could be the right place to start. I am upgrading my 12-month view from Hold in September to a minor Buy setting. This is my first bullish rating ever for the stock (writing on Seeking Alpha since 2013).
Of course, if China invades Taiwan in 2024, owning shares will be difficult, both practically and emotionally. Heck, the company could even be delisted in New York. This extra risk should not be ignored out of hand.
Valuation Story
The overall fundamental valuation setup is now at record lows in January 2024, measured since the company went public in America almost 10 years ago. Price to trailing sales (1.38x), earnings (9.6x), cash flow (5.9x), and tangible book value (1.77x) ratios are drawn below.
YCharts – Alibaba, Price to Basic Trailing Fundamentals, Since 2014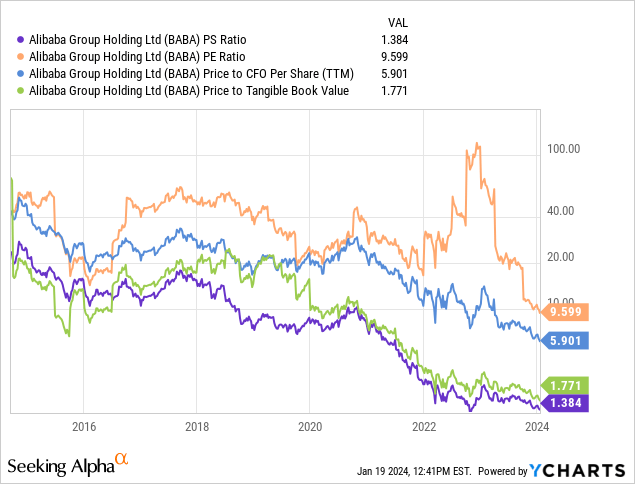
Even more interesting to me is the enterprise value situation. When we include the idea debts ($27 billion in debt and lease obligations as of September) are dramatically less than cash holdings ($78 billion), EV to EBITDA and sales multiples are reaching “deep value” territory for investors. For example, both numbers are in the range of 85% to 90% lower than 2021 peaks.
YCharts – Alibaba, Enterprise Valuations, Since 2014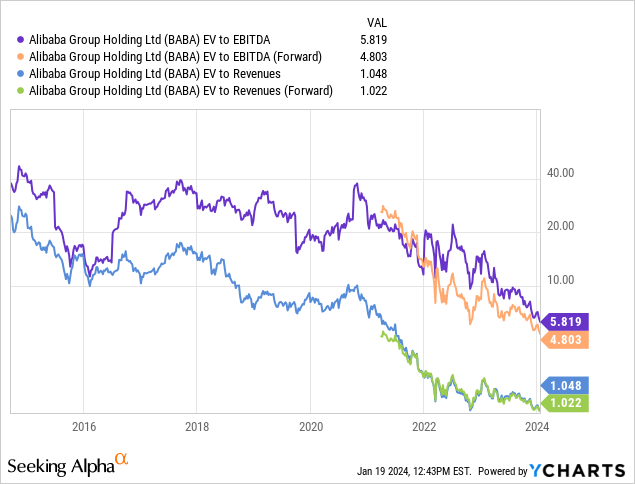
Comparisons to Amazon
While operating similar business models focused on matching consumer/business demand and sales through the internet, with a range of related operations from finance to cloud-based products sold online, Amazon may be the U.S. cousin of Alibaba for stock comparison shopping by investors.
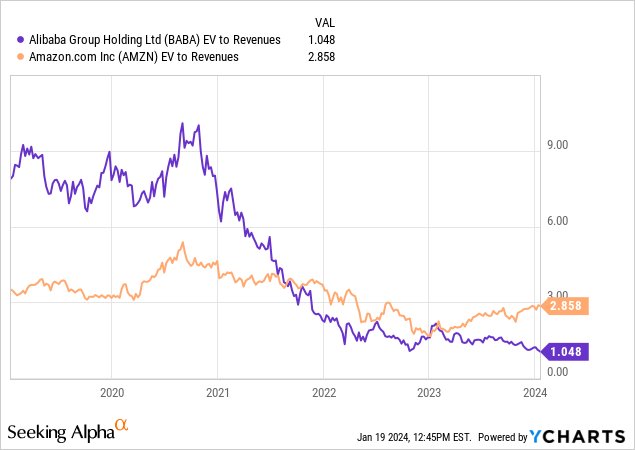
For this article, I will highlight 5-year charts of EV to core cash EBITDA generation and total sales. You will notice the valuation lines tracked in a similar manner until 2023. Today, the distance in investor pricing for both businesses is quite amazing. On EBITDA, Alibaba is priced at a 70% discount to Amazon, while sales sit 65% lower. In late 2020, Alibaba traded at a premium!
YCharts – Alibaba vs. Amazon, EV to Trailing EBITDA, 5 Years YCharts – Alibaba vs. Amazon, EV to Trailing Sales, 5 Years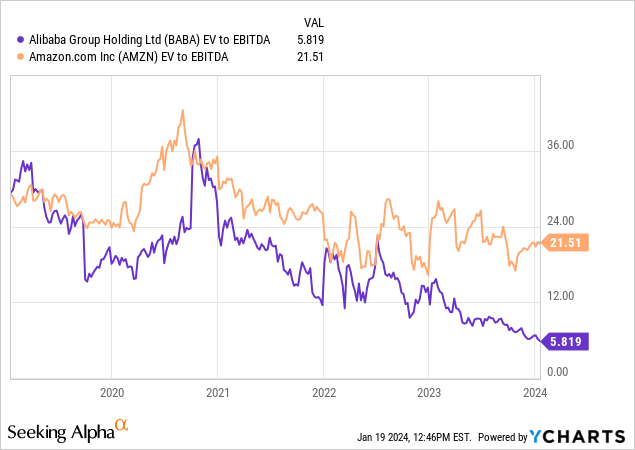
One excuse for Alibaba’s discount is sales and earnings growth are expected to lag Amazon into 2026 (although Amazon is also experiencing far slower growth than 5 or 10 years ago). Both businesses are getting quite large in size, while competition for online-focused sales is intense everywhere. At this stage, I would say both businesses are in the mature stage of growth.
Seeking Alpha Table – Alibaba, Analyst Estimates for FY 2024-26, Made January 18th, 2024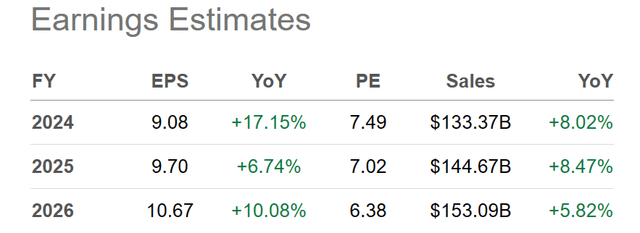
Below is a graph of Wall Street analyst estimates for sales growth by each. Visually, you can see Amazon is expanding faster. So, it does probably deserve valuation metrics higher than Alibaba. The question is how much difference should exist?
YCharts – Alibaba vs. Amazon, Actual & Analyst Revenue Estimates for 2022-26, Made January 18th, 2024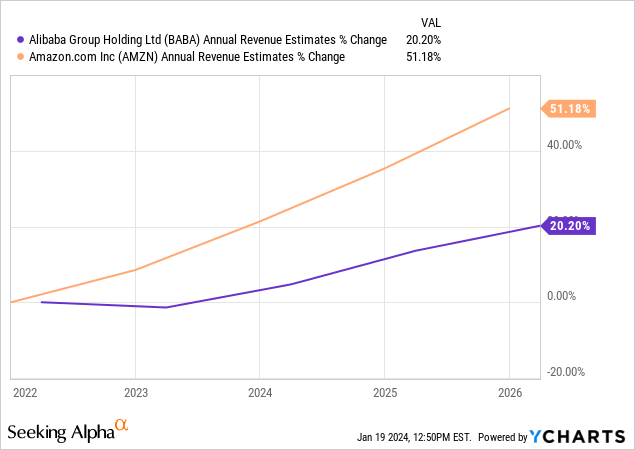
The eye-popping data point difference is Alibaba shareholders are projected to have access to an earnings yield approaching 14% annually on the current sub-$70 ADR price. Amazon remains at a very subpar earnings yield of 3.1% 2024-25 estimates. Amazon is even failing to deliver earnings yield close to the risk-free, 1-year Treasury rate just under 5%, while Alibaba is generating a number almost 3x short-term Treasuries for investors!
YCharts – Alibaba vs. Amazon, Forward Analyst Estimated Earnings Yield, Past 3 Years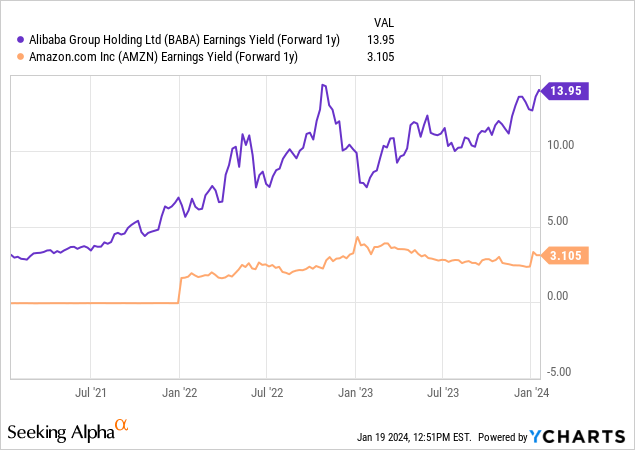
Seeking Alpha gives Alibaba a “B” Quant Valuation Grade, which I view as too pessimistic. I personally give shares a clear “A” grade. Why?
Seeking Alpha Table – Alibaba, Quant Valuation Grade on January 18th, 2024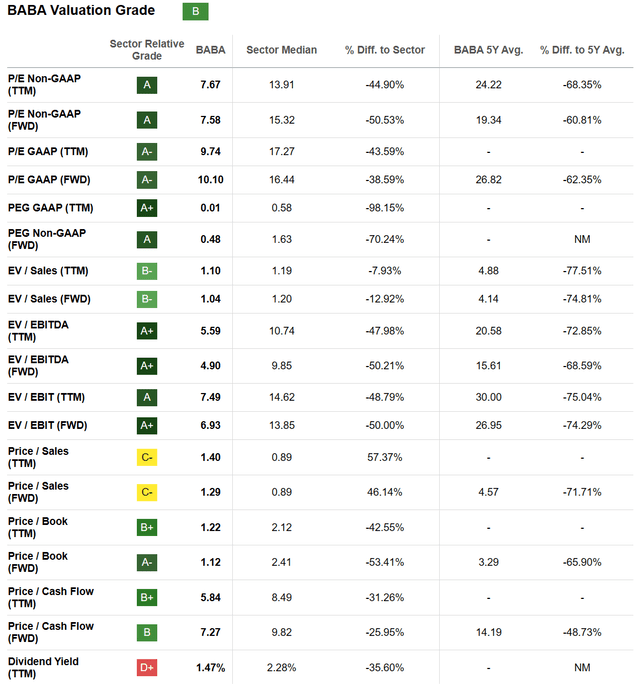
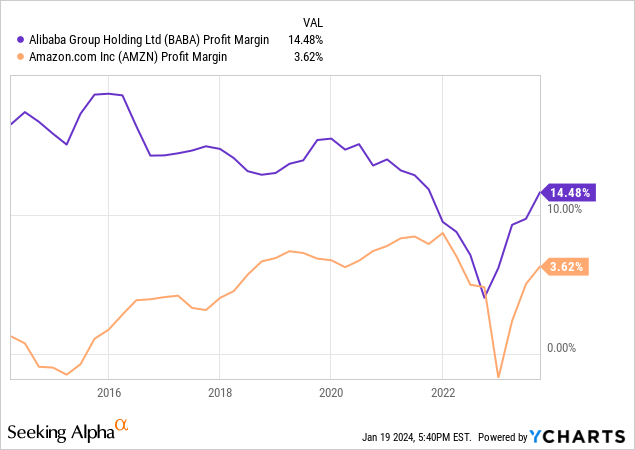
BABA’s high price to sales ratio is graded worse than peers. Nevertheless, this is a function of very strong profit margins, actually a good thing for shareholders (not graded in the SA exercise). For example, the company’s gross and final profit margins are better than DOUBLE what Amazon can generate.
YCharts – Alibaba vs. Amazon, Gross Profit Margins, Since 2014 YCharts – Alibaba vs. Amazon, Final After-Tax Profit Margins, Since 2014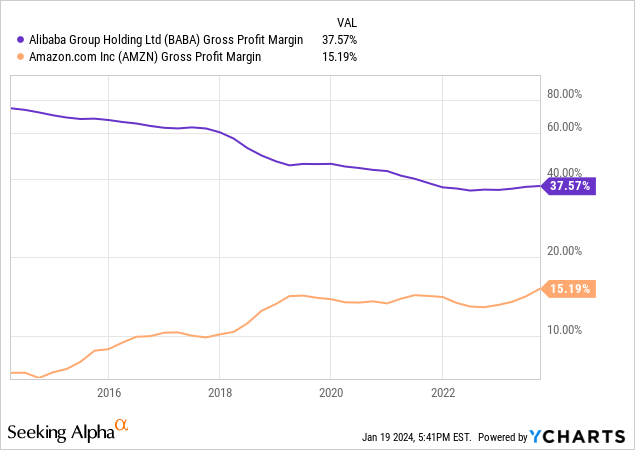
Rare Accumulation/Distribution Line Strength
Another reason I am more interested in Alibaba than a few months ago is found in the rare countertrend rise in the Accumulation/Distribution Line. I can only locate three other instances since 2014 of the ADL showing positive momentum “during” a price decline. If history holds true, this situation is incredibly bullish for intermediate-term buyers. All three past occurrences proved great times to buy before a 3-month to 18-month swing higher in the quote.
Below I have drawn an 18-month chart of daily price and volume changes for Alibaba. Usually, the ADL indicator and share price are tracked closely together, either up or down. However, the price slide since November has not been confirmed by a sliding ADL. In fact, the ADL has risen nicely (marked with a green line).
StockCharts.com – Alibaba, 18 Months of Daily Price & Volume Changes, Author Reference Point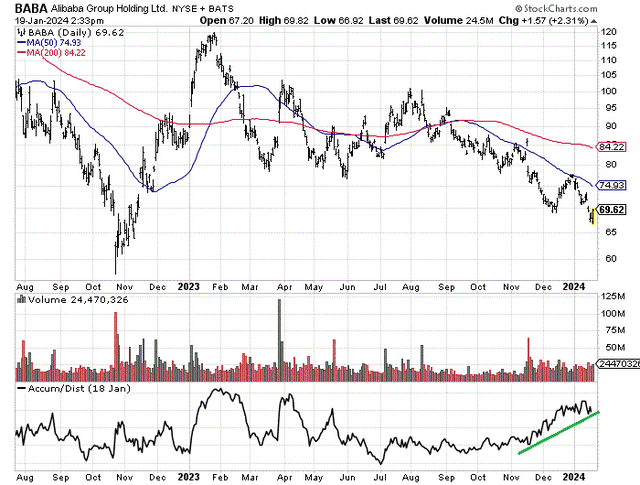
The last time the price sold off while the ADL did not was during the 2020 pandemic dump (circled in green). Measured from the final price bottom, BABA rose around +50% over the next four months. Before that, we can go back to Q4 of 2018 (green line). Measured from the first week of 2019, BABA gained +45% over four months.
StockCharts.com – Alibaba, Daily Price & Volume Changes, June 2018- July 2020, Author Reference Points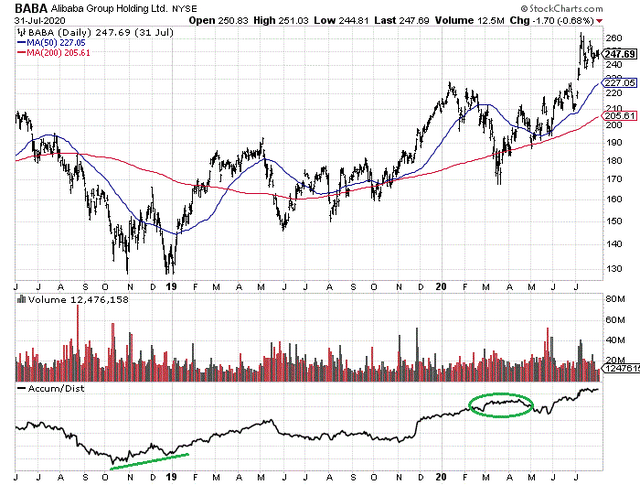
The initial example of rising ADL vs. a declining share quote over a number of months came at the beginning of 2016 (green line). From early February of that year, BABA’s quote rose +40% over less than three months, and +85% over eight months.
StockCharts.com – Alibaba, Daily Price & Volume Changes, Aug 2015-July 2017, Author Reference Point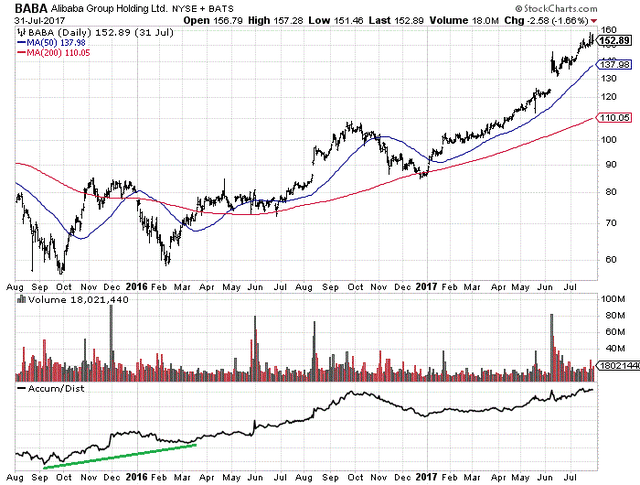
The interesting note of the first three positive ADL divergences is bottoms in price were reached between January and March, similar to the current pattern.
Otherwise, I would not categorize the Alibaba momentum chart as super-bullish or showing a variety of signs of a turnaround. Does this mean more downside is necessary? I would say no, BABA has a history of reversals (both up and down) without any significant advance warning.
Final Thoughts
I have not personally purchased Alibaba shares and may not in the end. But, if you are searching for Chinese exposure, I would start with this name. If the government becomes more accommodating to co-founder Jack Ma and managers of one of the largest businesses in China, an oversized jump in the share quote could be the future into 2025. The stock valuation could absolutely support a double or triple in price over the next 2-3 years (back to 2020-21 price levels with better underlying value) if China’s government gets out of the way.
Plus, the ability to return capital to shareholders in the form of stock buybacks and now a dividend are important steps in the right direction for U.S. domiciled accounts.
Against the sobering downside risk to ZERO (-100%) in a Chinese/U.S. war over Taiwan, the opposite and perhaps equal ability to gain +100% or +200% in a rosier, bullish reward outcome (less government regulation and a stronger Asian economy as the foundation) does seem to suggest a smarter risk/reward setup worthy of serious consideration. [Note: Alibaba shares would still be listed in Hong Kong with American ADRs likely worth something to U.S. citizens and foreigners, in the event New York’s listing is made illegal in the same way many Russian companies were effectively shunned on the 2022 invasion of Ukraine.]
I rate Alibaba a Buy in limited quantities. Risk reduction strategies include selling covered calls or setting a tight stop-sell order on your purchase (-10% for traders, -20% for long-term owners) to limit potential losses.
Thanks for reading. Please consider this article a first step in your due diligence process. Consulting with a registered and experienced investment advisor is recommended before making any trade.
Editor’s Note: This article discusses one or more securities that do not trade on a major U.S. exchange. Please be aware of the risks associated with these stocks.
Credit: Source link