
SHansche/iStock via Getty Images
Introduction
Safe Bulkers (NYSE:SB) is another mid-size bulk carrier company. It is an exciting proposition with its fleet of 46 vessels at an average age of ten years. Twenty-two ships are equipped with scrubbers, and 100% have a ballast water treatment system. SB has a solid balance sheet with 57% total debt to equity and 68.4% total liabilities to total assets. The company has top margins and returns compared to similar-sized companies. It pays dividends with 4.77% yields and, in November 2023, announced its stock buyback program. The company is undervalued, given its past multiples and compared to its peers. SB is one of my top picks in the bulker carries segment, and I give it a strong buy rating.
SB overview
In my opinion, SB is one of the best bulker companies to play the current bull cycle. Let`s look at company details to see why. The chart below from the last presentation shows SB at a glance.
SB presentation 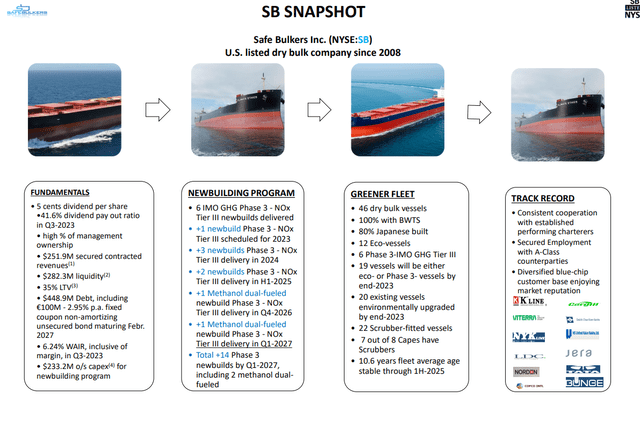
SB has a more extensive fleet, owning 46 ships, than similar-sized companies. They are well scattered across various sizes: 10 Panamax, 10 Kamsarmax, 18 Post Panamax, and 8 Capesize.
SB is focused on time charters instead of voyage or bareboat charters. In 3Q23, 15 of its ships were operated under spot time charters for up to three months. The remaining vessels were contracted under period time charters longer than three months. Eleven of the ships have chartered for more than two years. However, the average TC duration across the fleet is 0.7 years.
In a previous article on Pangaea Logistics (PANL), I discussed the pros and cons of voyage and time charters. In the case of PANL, voyage charters work perfectly due to their distinct fleet of ice-class vessels. They serve specific trade routes outside of the standard bulker voyages. However, SB owns standard-type ships traveling across the globe. That means there is more exposure to geopolitical risks, and, as we know, the shipping business benefits from growing global tensions.
We have a looming crisis in the Red Sea and a drought in the Panama Canal. The latter is more crucial for bulkers. SB fleet is perfectly positioned to benefit from those disruptions in the supply chain. Operating approx 30% of its ships under spot time charters exposes the company to day rates of parabolic growth.
The company has made significant progress in NOX and SOX emissions, having 22 vessels equipped with scrubbers. This represents 47% of the company`s fleet. For reference, only Genco Shipping (GNK) has a similar percentage (37%), although lower.
SB expects the delivery of 8 new vessels in the coming years.
SB presentation 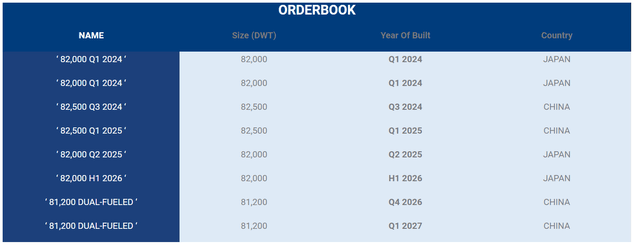
Three are expected to be delivered in 2024, two in 2025, one in 2026, and one in 2027. Two of the ordered ships are methanol dual fuel. 3Q23, the company received two new Kamsarmax ships: MV Pedhoulas and MV Morphou. Both vessels cover the IMO Regulation 13 for nitrogen oxide emissions (NOx).
SB balance sheet
Despite the constant capital investment in updating its fleet, SB maintains a healthy balance sheet with 57% total debt to equity and 37.4% total liabilities to total assets. The table below shows SB’s capital structure and interest coverage.
Koyfin 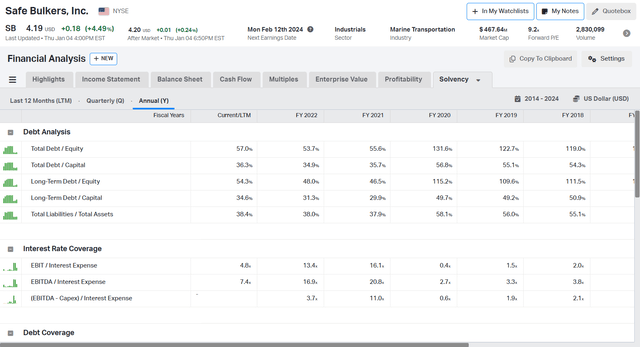
The progress over the years is significant. The company reduced its leverage by more than 100%. In 2020, SB had 131 total debts to equity and 58% total liabilities to total assets. Even at the bottom of the cycle in 2020, SB interest coverage was 2.7.
Let`s compare a few similar-sized companies with SB:
- Safe Bulkers (SB) $74 million cash; $440 million total debt; 0.17 cash to total debt ratio, total debt to equity 57%
- Pangaea Logistics (PANL) $87 million cash; $275 million total debt; 0.31 cash to total debt ratio, total debt to equity 73%
- Diana Shipping (DSX) $173 million cash; $657 million total debt; 0.26 cash to total debt ratio, total debt to equity 135%
- Grindrod Shipping (GRIN) $71 million cash; $168 million total debt; 0.42 cash to total debt ratio, total debt to equity 60%
- Genco Shipping (GNK) $48 million cash; $141 million total debt; 0.33 cash to total debt ratio, total debt to equity 15%
SB has the lowest cash-to-total debt ratio. On the other hand, the debt-to-equity ratio is the second lowest in the peer group.
The following table shows the SB liquidity position:
SB presentation 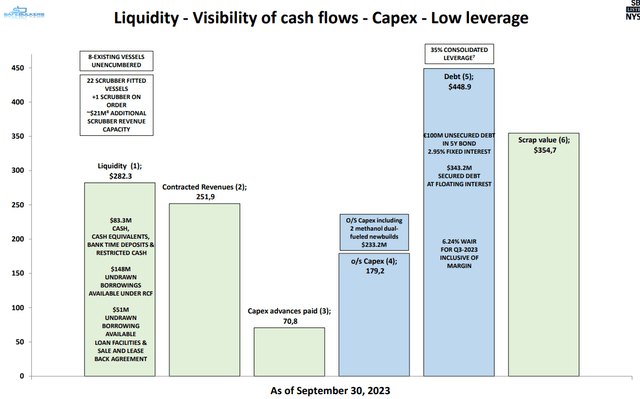
SB has $83 million cash, $148 million undrawn borrowings from the revolving credit facility, and $51 million undrawn from loan facilities and Sale and lease back agreements. In other words, the company has enough liquidity to cover its operations and capital costs.
SB has a $448 million debt. The debt is distributed between $100 million 5Y bonds and $343 million secured debt. The former will mature in February 2027, and the interest rate is 2.95%. The debt repayment schedule is shown below:
3Q23 statement 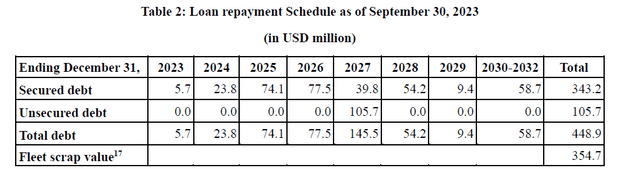
In 2023, SB must cover $23.8 million of its secured debt. 2025 SB must pay $77.5 million; in 2026, $74.5 million; and in 2027, $145.5 million. SB has enough liquidity and has shown its ability to generate cash flows during the cycle. The company generated $217 million in operational cash flow in 2021, $218 million in 2022, and $193 million in 2023 (for nine months).
SB profitability
In the list below, I compare SB’s profitability metrics against its peers:
- Safe Bulkers (SB) 62% gross margin, 52% EBITDA margin, 11.1% ROE, 5.1% ROTC
- Pangaea Logistics (PANL) 21% gross margin, 17% EBITDA margin, 11.4% ROE, 5.2% ROTC
- Diana Shipping (DSX) 65% gross margin, 49% EBITDA margin, 14.4% ROE, 6.0% ROTC
- Grindrod Shipping (GRIN) 29% gross margin, 7.8% EBITDA margin, (3.5)% ROE, 1.0% ROTC
- Genco Shipping (GNK) 36.5% gross margin, 26.3% EBITDA margin, 1.2% ROE, 3.71% ROTC
SB and DSX have the best profit margins and returns. As the figures above show, operating at a spot-time charter market in a bull cycle is a risky but beneficial endeavor.
The table below shows how SB’s profitability developed over the last five years.
Koyfin 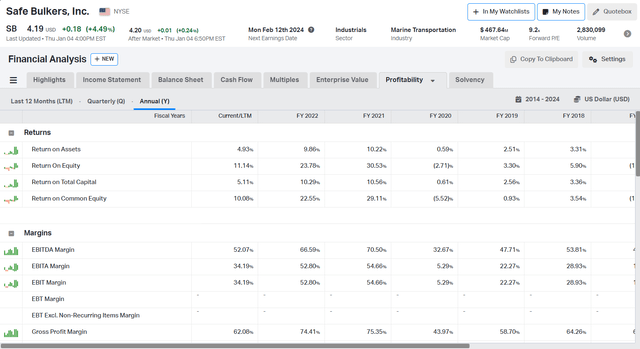
SB had negative returns only in 2020 at the bottom of the cycle. Since the company has realized respectable margins and returns. In 2021 and 2022, when the day rates recovered, SB had solid returns and margins.
I compare SB with similar-sized companies and one of the majors in the business, Star Bulk (SBLK), in the chart below based on total debt/total capital and ROTC. The goal is to assess SB management’s ability to allocate capital.
Koyfin 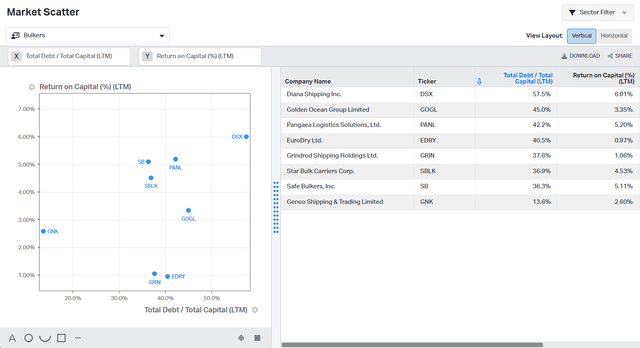
Dividing ROTC by TD/TC measures how prudently the managers invest the company`s capital. The higher, the better. SB holds the respectable second place with 14%, next to GNK with 20%. DSX, PANL, and SBLK scored 11%-13% on the ROTC vs. TD/TC ratio.
SB management is keen to add value for company shareholders.
Koyfin 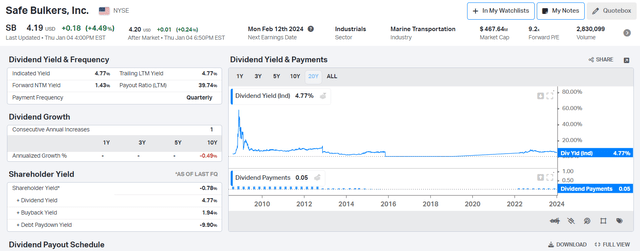
The company distributes dividends with a good yield at 4.77% and regularly repurchases company shares. On November 30, 2023, SB announced its authorized program to repurchase 5 million shares. This is 4.5% of the total SB common stocks and 8.1% of the public float.
SB Valuation
First, I will compare SB against the same companies from previous chapters:
- Safe Bulkers (SB) 2.8 EV/Sales, 5.38 EV/EBITDA, 0.57 P/BV
- Pangaea Logistics (PANL) 1.22 Ev/Sales, 7.15 EV/EBITDA, 1.12 P/BV
- Diana Shipping (DSX) 2.83 EV/Sales, 5.72 EV/EBITDA, 0.62 P/BV
- Grindrod Shipping (GRIN) 0.73 EV/Sales, 9.34 EV/EBITDA, 0.57 P/BV
- Genco Shipping (GNK) 1.99 EV/Sales, 7.56 EV/EBITDA, 1.02 P/BV
SB and DSX trade at the highest EV/Sales. SB has the lowest EV/EBITDA and P/TBV.
The table below shows SB multiples over the last ten years.
Koyfin 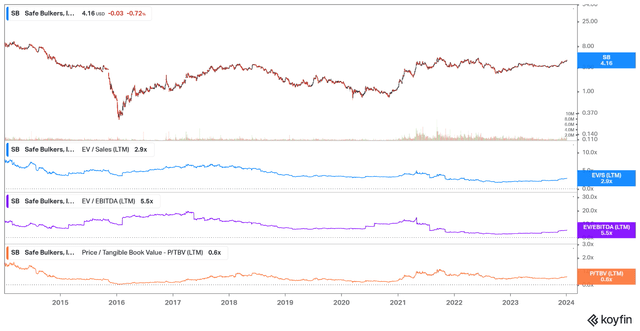
SB is deeply undervalued compared to its 10Y peaks (6.9 EV/Sales, 20 EV/EBITDA, 1.7 P/BV). Conversely, the company trades close to its 5Y average multiples (2.97 EV/Sales, 6.21 EV/EBITDA, 0.58 P/BV).
The company is undervalued, given its past multiples and compared to its peers. And in the coming months, its stock will reprice. In my opinion, we will reach higher highs in the current shipping cycle due to multiple catalysts like the Red Sea crisis and the Panama Canal drought. The shipping industry is not homogeneous, and the various classes of ships will be affected distinctly. The bulkers will benefit significantly from Panama Canal issues, while the containers and tankers will reap profits from the Red Sea crisis. SB is perfectly positioned to profit from those circumstances.
Risks
For the shipping companies, the financial risk is the most pronounced. They usually are heavily leveraged. The key to survival and success for every shipowner is knowing how to play the shipping cycle. Being overleveraged around the bottom of the cycle usually means the death penalty for the business.
SB has a robust balance sheet with $83 million cash and $199 million undrawn borrowings. The debt maturities are concentrated in 2025-2027, resulting in a $300 million debt to be repaid. Even at the current rates, SB will pay its debts. As I mentioned, I expect the rates to be higher for longer, enhancing the company’s profitability. With more cash at hand, SB will improve its liquidity positions further.
Investors takeaway
SB is one of my favorite stocks in the bulk carrier segment. 47% of its fleet consists of scrubber-fitted vessels, eight new ships are coming in the next few years, and the company`s focus is spot and period time charters. The company has a robust balance with adequate liquidity to cover its debt obligations and capital investments. SB has top margins and returns compared to similar-sized companies; apart from that, its management excels at capital allocation. SB distributes dividends with a good yield at 4.77% and regularly repurchases company shares. The company is undervalued, given its past multiples, compared to its peers. I give SB a strong buy rating.
Credit: Source link