
deepblue4you
FQAL strategy and portfolio
Fidelity® Quality Factor ETF (NYSEARCA:FQAL) started investing operations on 9/12/2016 and tracks the Fidelity U.S. Quality Factor Index. It has a portfolio of 126 stocks, a dividend yield of 1.35% and a total expense ratio of 0.15%.
As described by Fidelity, the underlying index starts from the largest 1000 U.S. stocks based on market cap and uses a rules-based proprietary methodology focused on higher profitability, stable cash flows, and good balance sheets. The index is rebalanced twice a year, and sector weights are reset to be sector-neutral relative to the parent index. The portfolio turnover rate was 43% in the most recent fiscal year.
The fund is mostly invested in large and mega caps companies (about 73% of asset value). The heaviest sector is technology (28.5%), followed by financials (13.3%) and healthcare (13.2%). The sector breakdown is very close to the SPDR® S&P 500 ETF Trust (SPY), which is consistent with the sector-neutral methodology (even if the parent index includes 1000 stocks instead of 500).
FQAL sector breakdown (Chart: author; data: Fidelity, SSGA)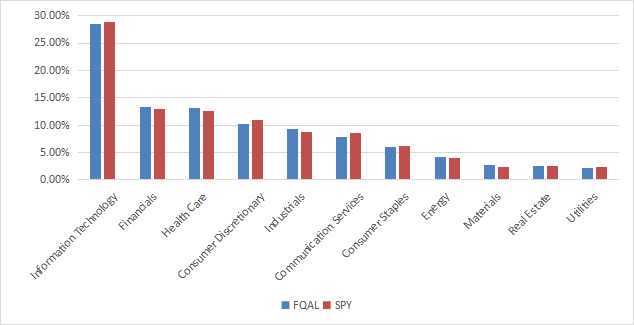
The portfolio is quite concentrated: the top 10 companies, listed below, represent 31.7% of asset value. Microsoft and Apple weigh about 15% together. Risks related to other individual companies are low.
|
Ticker |
Name |
Weight (%) |
EPS growth %TTM |
P/E TTM |
P/E fwd |
Yield% |
|
MSFT |
Microsoft Corp. |
7.54 |
11.28 |
36.23 |
33.33 |
0.80 |
|
AAPL |
Apple, Inc. |
7.39 |
0.45 |
31.51 |
29.56 |
0.50 |
|
GOOGL |
Alphabet, Inc. |
3.72 |
3.56 |
26.91 |
24.44 |
0 |
|
LLY |
Eli Lilly & Co. |
2.06 |
-18.63 |
107.34 |
88.05 |
0.89 |
|
TSLA |
Tesla, Inc. |
2.05 |
-4.04 |
84.19 |
85.32 |
0 |
|
UNH |
UnitedHealth Group, Inc. |
2.02 |
12.84 |
22.69 |
20.95 |
1.44 |
|
META |
Meta Platforms, Inc. |
1.97 |
7.92 |
31.59 |
24.92 |
0 |
|
V |
Visa, Inc. |
1.72 |
19.04 |
31.77 |
26.20 |
0.80 |
|
AVGO |
Broadcom Inc. |
1.71 |
25.65 |
34.19 |
23.97 |
1.86 |
|
ADBE |
Adobe, Inc. |
1.56 |
17.00 |
50.43 |
33.22 |
0 |
Fundamentals
FQAL is significantly more expensive than SPY, regarding the price/book and price/sales ratios, and cheaper in price/earnings. The aggregate earnings growth is superior to the benchmark.
|
FQAL |
SPY |
|
|
P/E TTM |
20.88 |
22.64 |
|
Price/Book |
5.6 |
4 |
|
Price/Sales |
4.06 |
2.58 |
|
Price/Cash Flow |
15.62 |
15.71 |
|
Earnings growth |
20.07% |
17.47% |
Data: Fidelity.
In my ETF reviews, risky stocks are companies with at least 2 red flags among: bad Piotroski score, negative ROA, unsustainable payout ratio, bad or dubious Altman Z-score, excluding financials and real estate where these metrics are unreliable. With this assumption, 8 stocks out of 126 are risky and they weight 6.3% asset value, which is a good point.
According to the calculation of aggregate quality metrics reported in the next table, portfolio quality is significantly superior to the benchmark. The return on assets is especially impressive.
|
FQAL |
SPY |
|
|
Altman Z-score |
7.01 |
3.62 |
|
Piotroski F-score |
6.14 |
5.73 |
|
ROA % TTM |
15.42 |
7.24 |
Performance
Since inception, FQAL has lagged the S&P 500 by 75 bps in annualized return. Risk measured in drawdown and price volatility is similar to the benchmark.
|
Total Return |
Annual Return |
Drawdown |
Sharpe ratio |
Volatility |
|
|
FQAL |
141.30% |
12.88% |
-33.71% |
0.68 |
16.41% |
|
S&P 500 |
153.17% |
13.63% |
-33.72% |
0.71 |
16.66% |
FQAL is on par with the S&P 500 in 2023:
FQAL vs S&P 500, year-to-date (Seeking Alpha)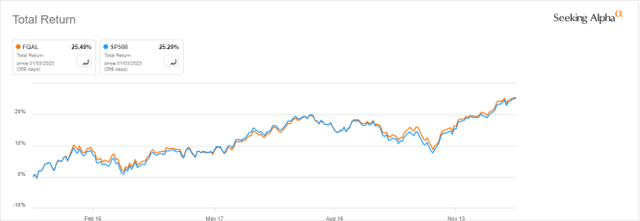
FQAL vs. competitors
The next table compares characteristics of FQAL and the three largest U.S. quality ETFs:
- iShares MSCI USA Quality Factor ETF (QUAL)
- Invesco S&P 500 Quality ETF (SPHQ)
- JPMorgan U.S. Quality Factor ETF (JQUA).
|
FQAL |
QUAL |
SPHQ |
JQUA |
|
|
Inception |
9/12/2016 |
7/16/2013 |
12/6/2005 |
11/8/2017 |
|
Expense Ratio |
0.15% |
0.15% |
0.15% |
0.12% |
|
AUM |
$386.46M |
$36.14B |
$6.75B |
$3.35B |
|
Avg Daily Volume |
$2.06M |
$234.48M |
$57.44M |
$29.71M |
|
Number of Holdings |
133 |
130 |
102 |
249 |
|
Assets in Top 10 |
31.20% |
37.09% |
44.73% |
19.47% |
|
Div. Yield TTM |
1.35% |
1.16% |
1.42% |
1.19% |
FQAL is by far the smallest (in assets) and less liquid (in dollar volume) of this group. The next chart compares total returns, starting on 11/13/2017 to match all inception dates. FQAL has lagged its competitors. The best performer is the JP Morgan fund JQUA.
FQAL vs competitors since 11/13/2017 (Seeking Alpha)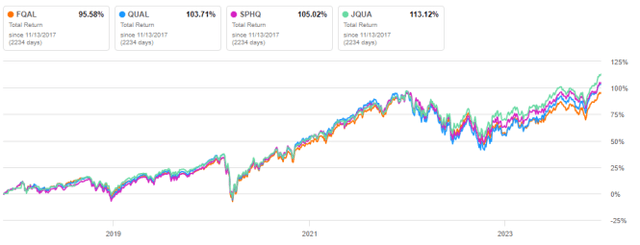
In 2023, FQAL is on par with SPHQ and JQUA, but behind QUAL:
FQAL vs competitors, year-to-date (Seeking Alpha)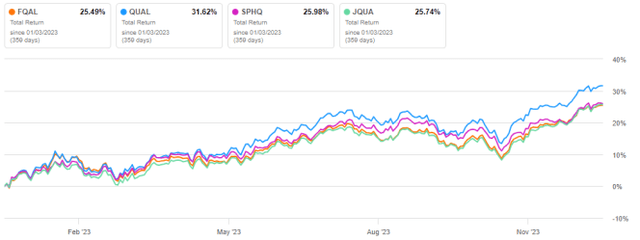
Takeaway
Fidelity® Quality Factor ETF implements a sector-neutral quality strategy in a large cap universe. Holdings are selected by systematic rules based on profitability, stable cash flows and good balance sheets. As expected, quality metrics are superior to the benchmark, especially the return on assets. Nevertheless, FQAL has slightly lagged the S&P 500 Index since inception in September 2016. It has also lagged its three larger competitors for 6 years. The sector-neutral constraint has likely been a drag for the fund: JQUA and SPHQ, which are more flexible regarding sector weights, have performed better.
Credit: Source link