
syahrir maulana
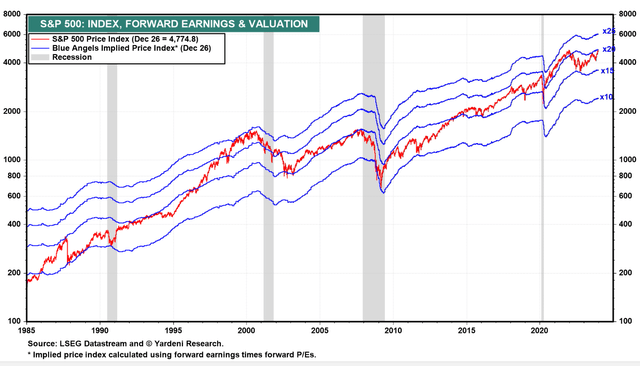
One of my main investment themes heading into 2024 is the potential outperformance of small-cap equities as they play ‘catch-up’ to the mega-cap ‘Magnificent 7’ stocks. As long as the economy holds up, I believe there is valuation upside to small-cap equities as the S&P 600 SmallCap Index only trades at a forward P/E of 15x (Figure 1) while the large-cap focused S&P 500 Index is closer to 20x Fwd P/E (Figure 2) and the ‘Magnificent 7’ are > 30x Fwd P/E.
Figure 1 – S&P 600 SmallCap Fwd P/E (yardeni.com) Figure 2 – S&P 500 Fwd P/E (yardeni.com)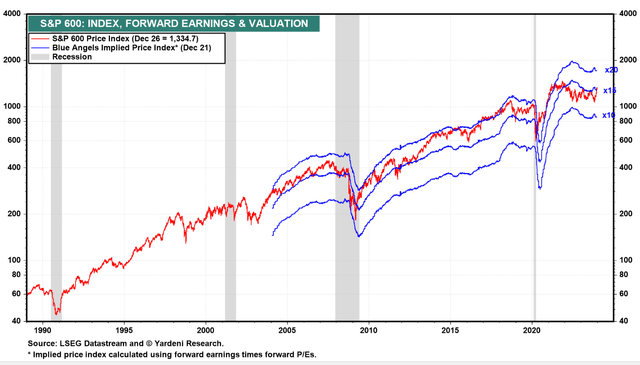
This article examines the Pacer US Small Cap Cash Cows 100 ETF (BATS:CALF), a value-focused small-cap fund. Overall, I like CALF’s focus on high free cash flow companies, as it avoids unprofitable concept stocks with ‘boom-bust’ returns. I rate the CALF ETF a buy.
Fund Overview
The Pacer US Small Cap Cash Cows 100 ETF provide exposure to U.S. small-cap companies with the highest free cash flow yields. The CALF ETF is modeled after the popular Pacer US Cash Cows ETF (COWZ) and has $6.6 billion in assets with an operating expense ratio of 0.55%.
Strategy
The CALF ETF’s strategy is to screen the S&P 600 Index for the top 100 companies based on projected free cash flow (“FCF”) and earnings over the next 2 fiscal years. Companies with negative FCF or earnings are removed from the universe. In addition, financial companies and REITs are also excluded (Figure 3).
Figure 3 – CALF strategy overview (CALF factsheet)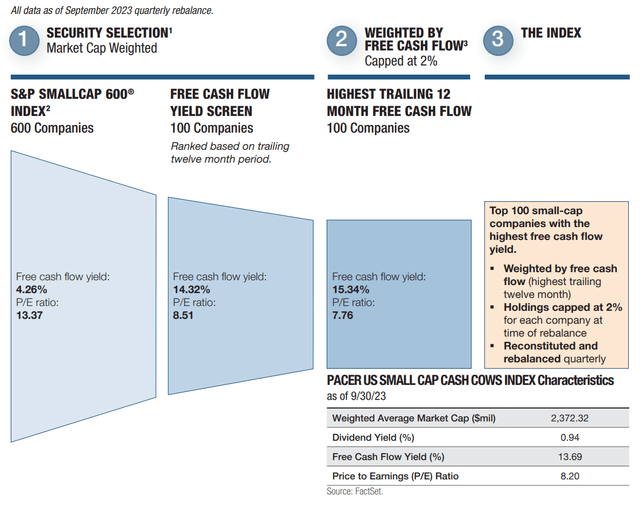
The companies are then ranked by their trailing 12-month free cash flow yield, with individual weights capped at 2%. The index is reconstituted and rebalanced quarterly.
The two key ideas behind CALF’s strategy are that high-quality companies tend to have strong free cash flows, and higher free cash flow yields signal the companies are trading at a discount.
Portfolio Holdings
Figure 4 shows the CALF ETF’s sector breakdown as of December 26, 2023. The Fund’s largest sector weights are Consumer Discretionary (35.9%), followed by Industrials (16.8%), Information Technology (10.9%), Energy (10.6%) and Health Care (10.1%).
Figure 4 – CALF sector allocation (paceretfs.com)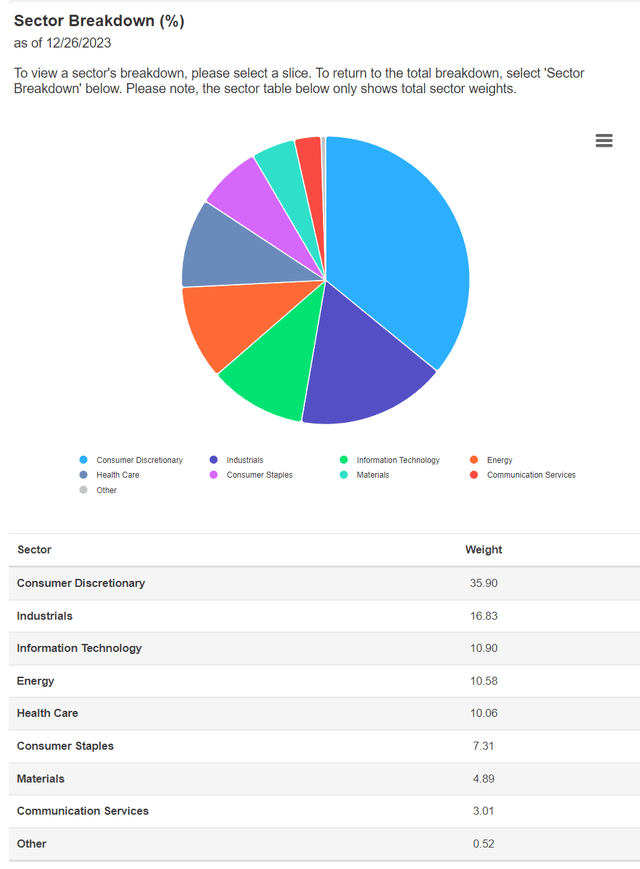
Surprisingly, despite the ‘value’ tilt of the FCF yield factor, the CALF ETF is not overweight defensive sectors like Utilities and Consumer Staples.
Figure 5 shows the top 10 holdings of the CALF ETF as of December 27, 2023. Since the CALF ETF caps individual positions at 2%, the ETF is not overly concentrated with the top 10 holdings only accounting for 20.5% of the portfolio.
Figure 5 – CALF top 10 holdings (paceretfs.com)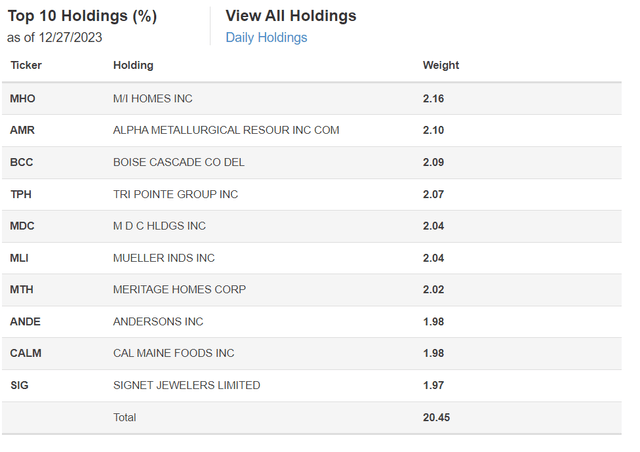
The CALF ETF currently skew heavily towards homebuilders, with 4 of the top 10 positions being homebuilders as the industry is seeing strong demand and pricing power as prospective homeowners are forced to buy new construction homes due to high mortgage rates crimping resale units and activity.
However, if we look historically, the CALF ETF’s industry allocation does move around, depending on analysts’ forecast for free cash flow yields. For example, as at April 30, 2023, 17.2% of the fund was invested in Energy companies as Energy was deemed to have strong forward earnings earlier in the year (Figure 6).
Figure 6 – CALF industry allocation, April 30, 2023 (CALF 2023 annual report)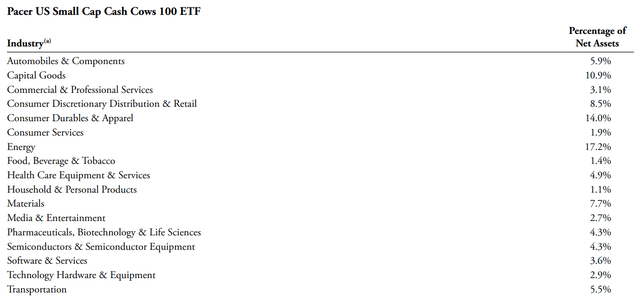
Overall, CALF’s portfolio selection methodology ensures the fund is always invested in the companies with the highest forecasted free cash flow yield within the small-cap universe.
Returns
Returns for the CALF ETF have been strong, even in the past year when small-caps have lagged in general. The CALF ETF has delivered 1/3/5 year average annual returns of 11.2%/15.5%/12.5% respectively to November 30, 2023, with an impressive 37.3% return YTD to December 26 (Figure 7).
Figure 7 – CALF historical returns (morningstar.co)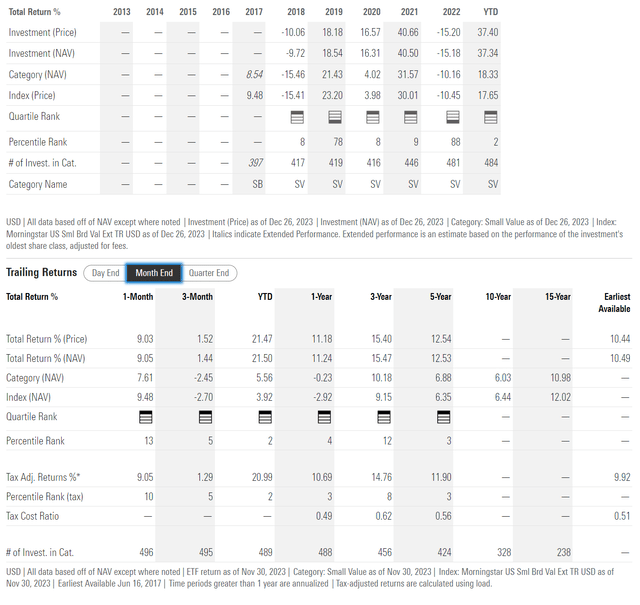
Comparing CALF to its peer group, the Small Value category in Morningstar, the CALF ETF has been a top quartile fund on every time frame since inception.
CALF Significantly Beats The Index
For me, I always like to compare different funds and strategies against passive index ETFs, as this helps me understand the ebbs and flows of performance. Comparing the CALF ETF against the iShares Core S&P Small-Cap ETF (IJR) that tracks the S&P 600 Index, we can see that CALF has impressively outperformed IJR by over 300 bps p.a. since inception, with a 9.6% CAGR return vs. 6.6% (Figure 8).
Figure 8 – CALF vs. IJR (Author created with Portfolio Visualizer)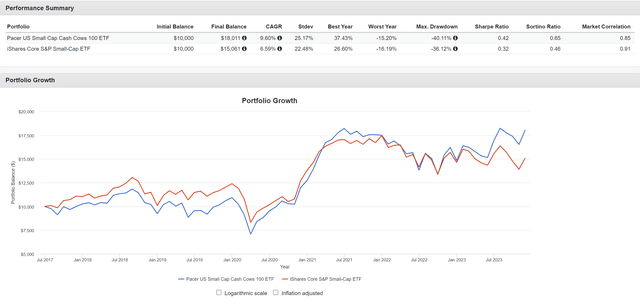
Although CALF has slightly higher volatility (25.2% vs. 22.5%), its higher returns give the CALF ETF a higher risk-adjusted return, with Sharpe ratio of 0.42 vs. 0.32 for IJR.
CALF’s outperformance has really shone through in the past year, as the IJR ETF had been almost flat to the end of November while CALF had returned over 20% (Figure 9).
Figure 9 – IJR historical performance (morningstar.com)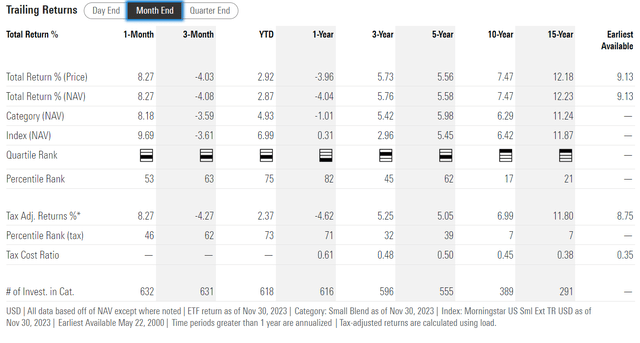
This is because many small-cap companies are unprofitable growth stocks that depend on low interest rates to finance their operations. With higher interest rates, these unprofitable companies struggled to stay afloat.
Distribution & Yield
Although the CALF ETF focuses on high free cash flow companies, the fund itself does not pay a high distribution yield, with a trailing distribution yield of only 1.1% (Figure 10).
Figure 10 – CALF distribution yield (Seeking Alpha)
Seasonality Set To Slow Down For Small-Caps…
After an impressive December, where the CALF ETF has returned 13% and counting, I believe small-caps and the CALF ETF are due for a breather as seasonality tends to be unfavourable for the small-cap asset class in the first few months of the year (Figure 11).
Figure 11 – Small-cap seasonality (equityclock.com)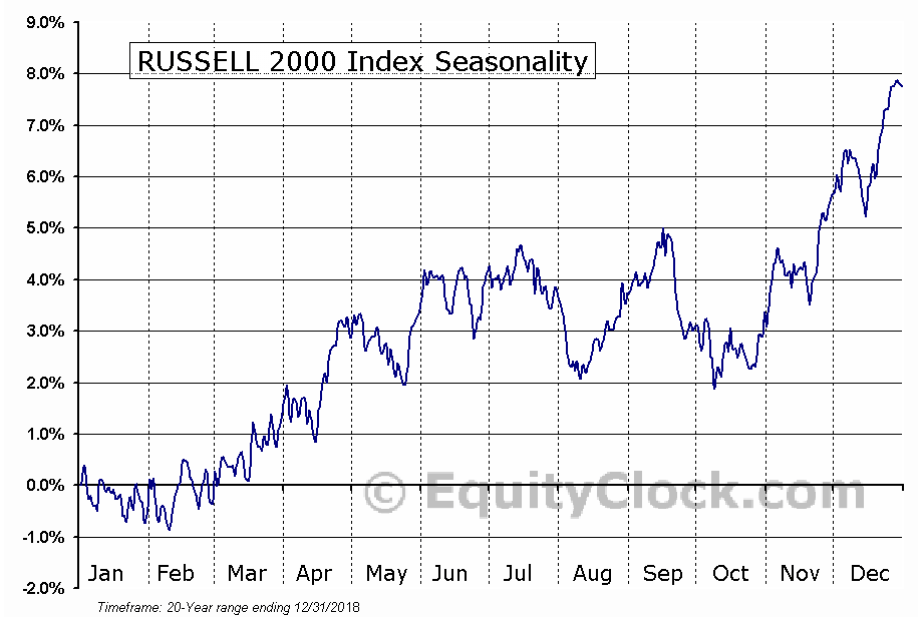
…But Catch Up Is Possible If Economy Continues To Perform
However, looking farther out, as I mentioned at the beginning of this article, small-caps in general are set to outperform as institutional investors may take advantage of the large valuation difference between small- and large-cap stocks.
Furthermore, due to fund’s selection methodology, the CALF ETF’s portfolio screens even more attractive than the small-cap asset class, with an overall portfolio free cash flow yield of 13.7% and P/E ratio of 8.2x (Figure 3 above).
Risks To CALF
However, there are a couple of risks that I can foresee with CALF’s strategy. First, as projected free cash flow yields are only estimates, actual free cash flows may disappoint, particularly if the economy suffers from macro shocks like pandemics and recessions. For example, the CALF ETF suffered a 40% drawdown during COVID as the pandemic was unexpected and negatively impacted earnings across the economy.
Another risk is that the CALF ETF is reconstituted and rebalanced every quarter. This could create large turnover for the fund. The CALF ETF consistently has over 100% portfolio turnover (Figure 2). High turnover rates increase trading expenses, and can also lead to capital gains being distributed to investors.
Figure 12 – CALF has high turnover (CALF annual report)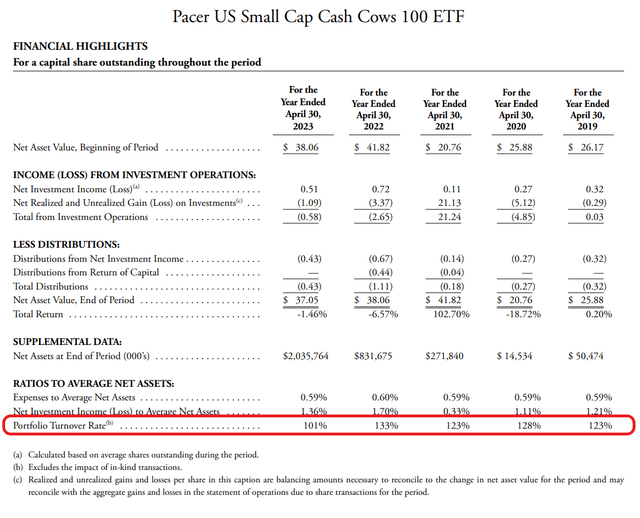
Finally, as free cash flow yield is a “value” factor, the fund may underperform during periods when the market prefers “growth” investments, like the years leading up to 2020. However, by focusing on profitable and FCF generating companies, the CALF ETF does avoid owning unprofitable concept stocks like Proterra and Farfetch that often go into financial distress when markets turn sour.
Conclusion
For investors looking for small-cap exposure with a ‘value’ tilt, I believe the CALF ETF is a good choice. The CALF ETF focuses on small-cap companies with the highest projected free cash flow yields. This helps the fund avoid many of the cash-burning, unprofitable small-cap concept stocks that suffer when cheap financing is no longer available.
However, investors should keep in mind that “growth” and “value” investing ebbs and flows, and so when value investing is out of favor, the CALF ETF may underperform the market.
Given my positive outlook for small-caps, I believe the CALF ETF will outperform in the coming quarters. I rate the CALF ETF a buy.
Credit: Source link