
miniseries
I am coming into 2024 in a decent position. My MinVar equity portfolio, designed to extract the best from both worlds in the perennial battle between growth and value, has done largely what it is supposed to do. It has offered positive, but below-beta, returns with below-beta volatility, the latter which means that your humble blogging investment analyst has been able to sleep calmly at night. In bonds, I moved my exposure onto the front early in 2023 in line with the yield curve inversion. At this point, I see no reason to change that strategy. Why buy negative carry in duration when you don’t have to? There will be a time to take a strong bet on duration, but I can’t really see that point until either the front end has collapsed under the weight of global central bank easing, or unless the curve rinses everyone by bear-steepening sufficiently to restore a positive roll and carry in the long bond. In other words, I don’t see any reason to buy duration as long as the curve is still deeply inverted.
In this entry, I will do two things. First, I will look at the macro backdrop at the start of 2024, and secondly I will run through the portfolio, how it is doing, and what changes I have made, or intend to make, to beat my investments into shape for 2024.
Soft landing vibes
Inflation is falling rapidly, the Fed’s hawkish facade has cracked, and the ECB will soon follow. Granted, policymakers have been busy pushing back against shifting market expectations in the past few weeks, but as long as inflation is falling rapidly, talk will be cheap. The S&P 500 is up around 15% since the beginning of November, and the US 10-year yield is down a cool 100 bp over the same period. In other words, markets have embraced the soft landing. It is always worth asking in such a situation whether this is a case of markets buying the rumour and selling the fact. Time will tell, but even if the soft landing trade loses a few steps in the next few weeks – it looks to be losing steam coming into Christmas – the shift in sentiment is consistent with the data. The four charts below clearly point to a near-term pick-up in global macroeconomic momentum, though in fairness also a relatively modest one, for now at least. It is now very interesting to see whether the improvement in the momentum of global leading indicators can be sustained at the start of 2024.
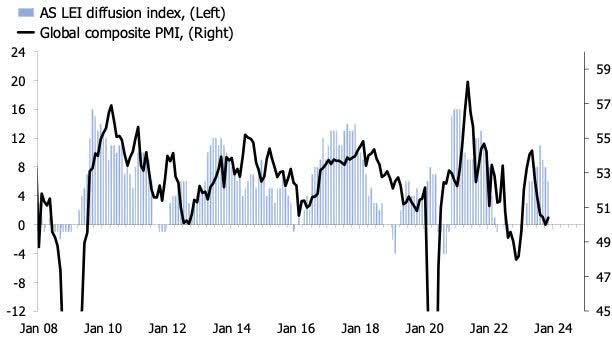
The first two charts plot my diffusion index of OECD leading indicators – combining low and rising and high and rising – alongside CBP global industrial output and trade and the global composite PMI. Global industrial production and trade was still falling on a year-over-year basis at the end of Q3, but the shift in leading indicators suggest that growth should improve through Q4 and into the first quarter of 20234. In other words, this picture suggests that the global hard data for manufacturing and trade should perk up in the next three to six months. Similarly for the global PMI, which has been languishing around 50 since July, the shift in leading indicators suggest that 52 or 53 should be doable in Q1.
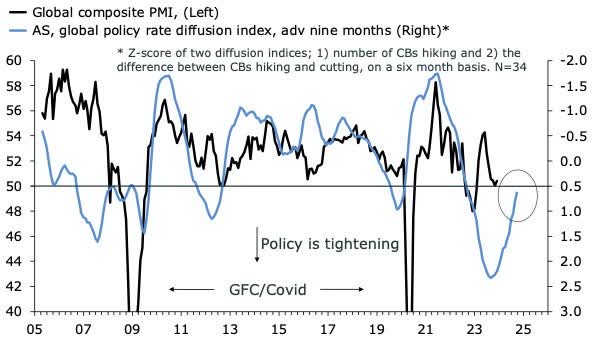
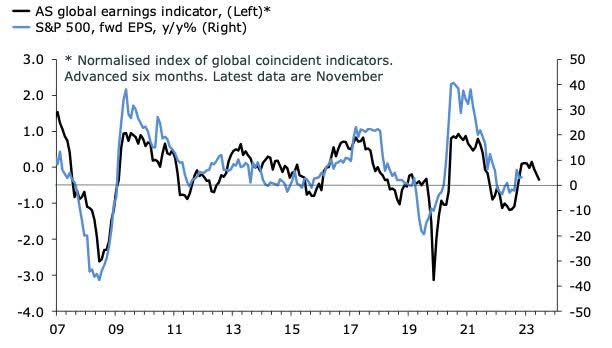
The third chart shows that the global monetary policy cycle has clearly turned. Many EM central banks have been cutting rates for a while, and with developed market inflation now falling rapidly, it is only a matter of time before the big global central banks start cutting. To be clear, I think the window for DM rate cuts could well be relatively small next year, but it is there all the same. Finally, the fourth chart shows that the pick-up in coincident global indicators points to a further improvement in the growth rate of earnings expectations, here on the S&P 500.
Better times ahead for hard data in manufacturing and trade? Will the global PMI rise further above 50 in Q1? The global monetary policy cycle is turning Earnings expectations can improve further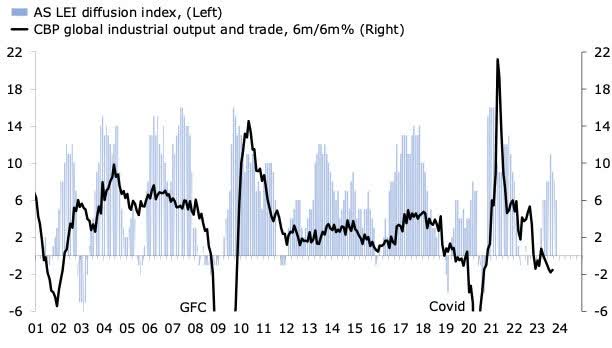
What to do with high-flying tech?
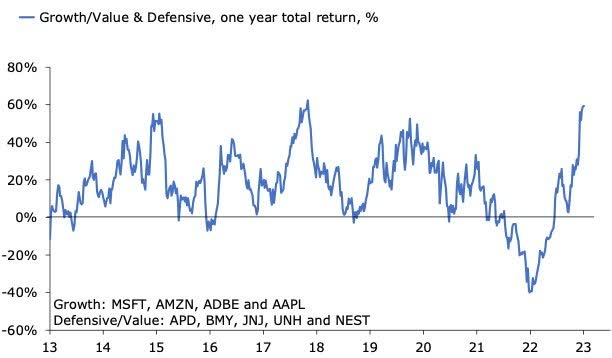
If you had told me that DM central banks would raise their policy rates by 400-500bp and the stock market would still be dominated by a few select large-cap tech firms, I would have laughed. Guess what, I am not laughing. Here we are discussing the Magnificent Seven, which, according to Bloomberg’s Cameron Crise, are responsible for just under two-thirds of the S&P 500’s rally in the past year. This inevitably imposes a burning question on most investors; what to do with their exposure to high-flying tech at the start of 2024? I’ve tried to answer that question from the point of view of my own investments. The chart below shows the total return of my tech exposure relative to the return of my exposure to boring defensive and value stuff. It’s a pretty staggering chart. From a low point of a trailing -40% relative return at the end of 2022 to +60% now, the reversal in the relative performance of tech has been spectacular. But will it continue? I have my doubts. The second below backtests the current setup in the numbers. It plots a binary indicator for every time the trailing excess return of tech, in my portfolio sample, has been above 50% alongside the price action in the Nasdaq 100. The average three-month return after such signal is -9% in this particular sample, with a negative return in 17 out 18 instances of the signal going off.
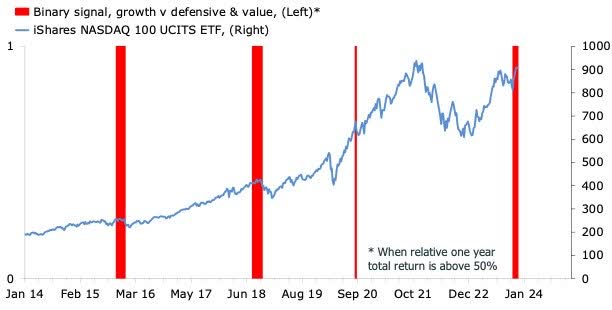
This seems like fairly good reason to shave off a touch of tech exposure, which is what I have done by selling my position in Adobe (ADBE) at a decent profit and buying more of BMY and J&J (JNJ) . This leaves the portfolio in the following state at the start of 2024. I have a more substantial rebalancing exercise coming up, but not until later in the first quarter.
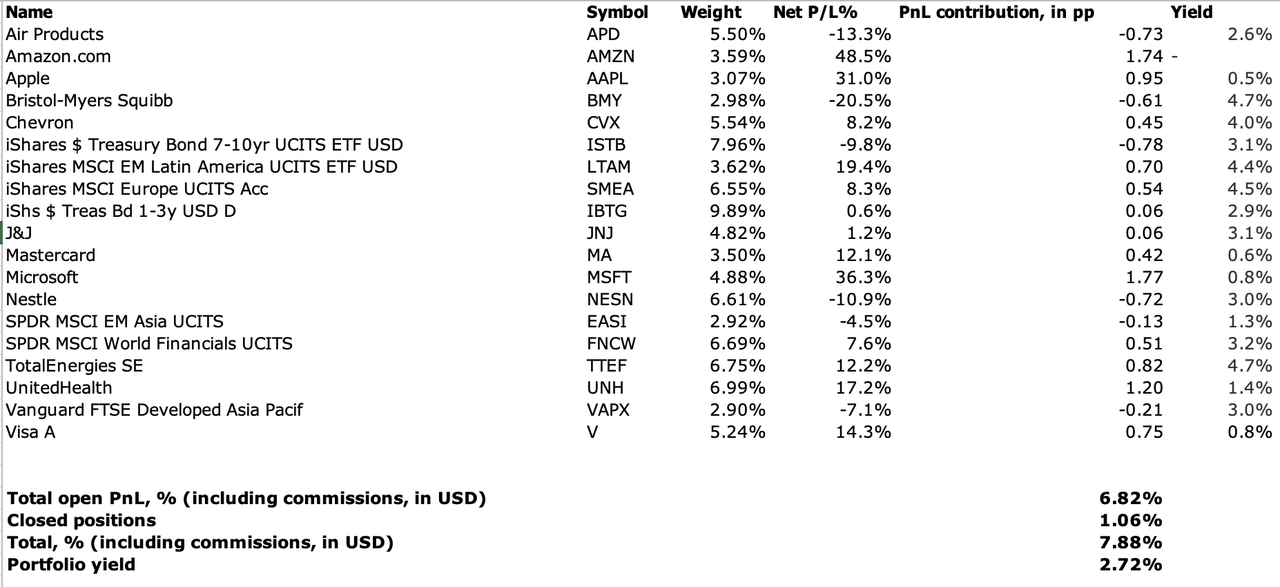
The Asian exposure is a bit of an embarrassment, and the portfolio is also short small-cap exposure. I am considering my options on both. This is the final market blog entry this side of the New Year. I want to thank everyone for reading, and I wish everyone a Merry Christmas and a happy New Year.
Original Post
Editor’s Note: The summary bullets for this article were chosen by Seeking Alpha editors.
Credit: Source link