

VioletaStoimenova
A Quick Take On TriNet
TriNet Group, Inc. (NYSE:TNET) provides a range of outsourced human capital management services to organizations worldwide.
TNET is managing costs well and is seeing an improved outlook from buyers as they look ahead.
Although the stock has performed very well in the past twelve months due to an increase in valuation multiple, I believe it has more room to rise, so my outlook for TriNet Group, Inc. is a Buy.
TriNet Overview And Market
Dublin, California-based TriNet Group was founded in 1988 to provide human resource services to businesses.
The company focuses on small and medium-sized businesses (“SMBs”) needing a variety of staffing and related solutions, including acting as a professional employer organization.
The firm is headed by president and CEO Mr. Burton Goldfield, who has been CEO since 2008 and was previously CEO at Ketera Technologies.
Mr. Goldfield led TriNet’s acquisition of Gevity in 2009. Gevity was a human resources outsourcing company.
The company’s primary offerings include the following:
-
Payroll Services
-
Risk Mitigation
-
Insurance Services
-
Professional Employer Organization [PEO].
TriNet acquires customers through its direct sales and market efforts as well as through its online and other marketing outreach processes.
According to a 2023 market research report by Grand View Research, the global market for human resource management was estimated at $21.7 billion in 2022 and is forecast to reach $56.5 billion by 2030.
This represents a forecast CAGR (Compound Annual Growth Rate) of 12.7% from 2022 to 2030.
The main drivers for this expected growth are a growing use of automated and digitized HR operations to improve operational efficiencies and increase flexibility in various economic environments.
The chart here shows the estimated growth trajectory of the U.S. human resource management market:
Grand View Research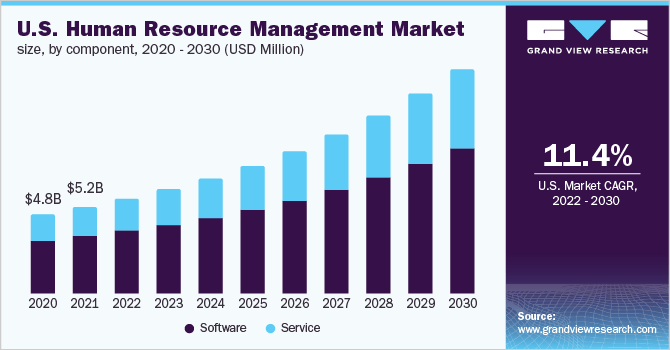
Major competitive or other industry participants include:
-
Paychex
-
Insperity
-
Accenture
-
ADP
-
Cezanne HR
-
Ceridian HCM
-
Kronos
-
Mercer
-
PwC
-
Cegid
-
UKG
-
Workday.
TriNet’s Recent Financial Trends
Total revenue by quarter (blue columns) has risen slightly due to some hiring challenges in the technology sector; Operating income by quarter (red line) has remained stable:
Seeking Alpha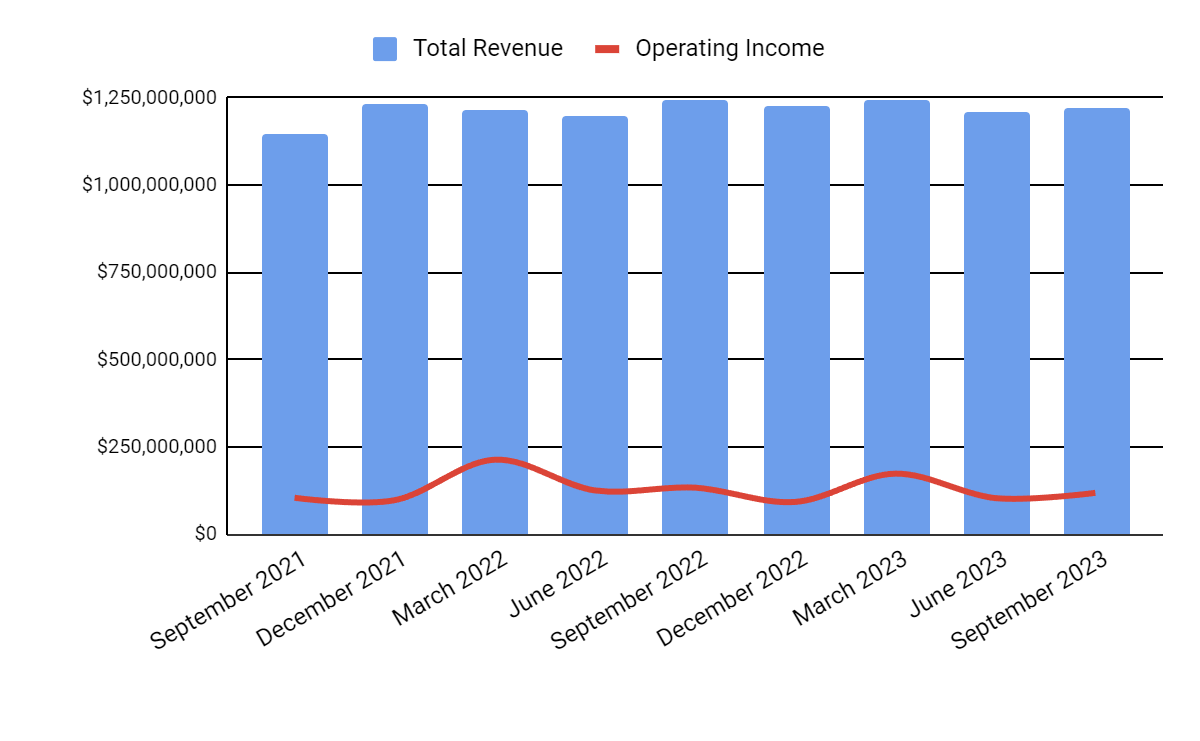
Gross profit margin by quarter (green line) has remained stable in recent quarters; Selling and G&A expenses as a percentage of total revenue by quarter (amber line) have trended slightly higher more recently:
Seeking Alpha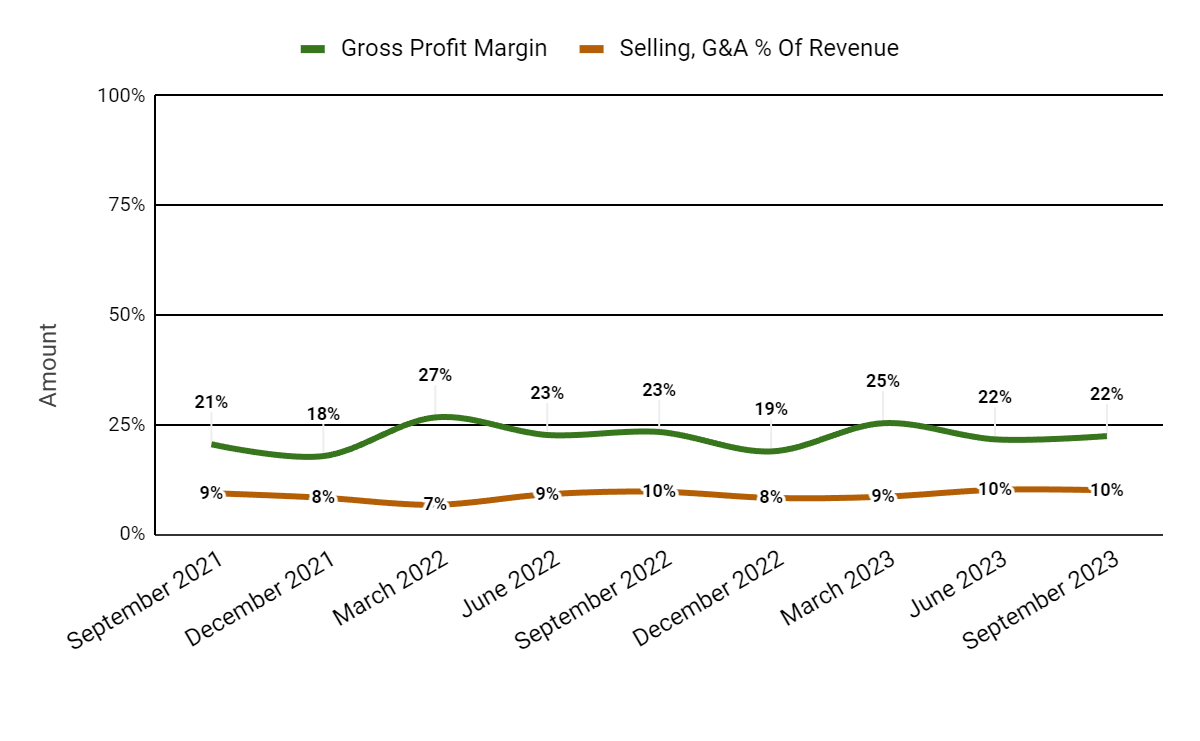
Earnings per share (Diluted) have fluctuated seasonally as the chart shows below:
Seeking Alpha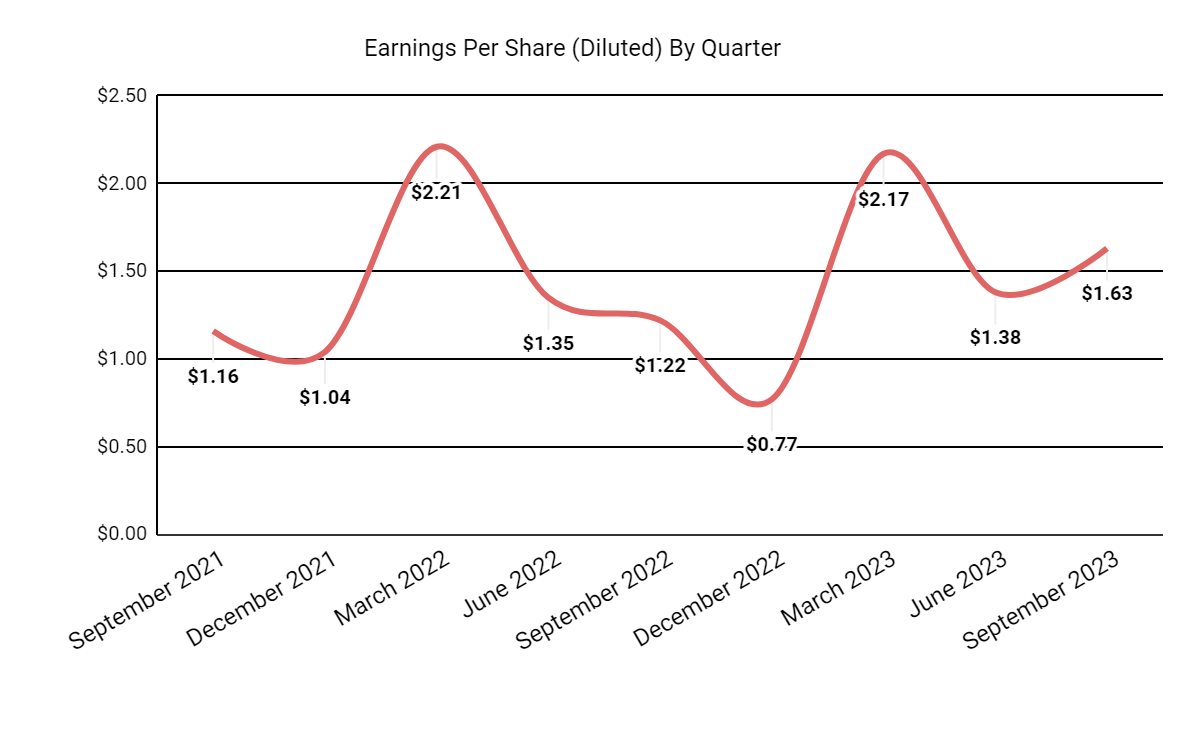
(All data in the above charts is GAAP.)
In the past 12 months, TriNet’s stock price has risen by 95.34% vs. that of Insperity, Inc.’s (NSP) gain of only 4.16%:
Seeking Alpha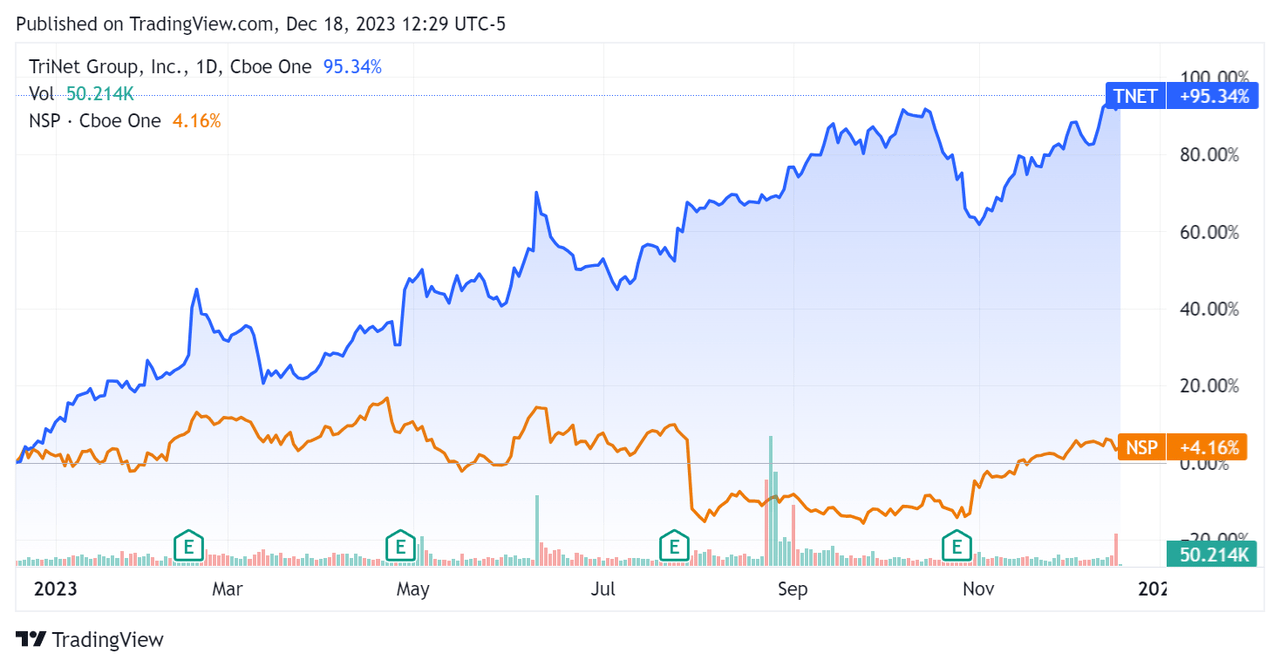
For balance sheet results, the firm ended the quarter with $245.0 million in cash, equivalents and short-term investments and $1.1 billion in total debt, all of which was categorized as long term.
Over the trailing twelve months, free cash flow was $372.0 million, during which capital expenditures were $71.0 million. The company paid $59.0 million in stock-based compensation in the last four quarters.
Management appears to have reduced its R&D spend in recent quarters as a percentage of total revenue, likely to assist the firm in retaining its profitability targets.
Valuation And Other Metrics For TriNet
Below is a table of relevant capitalization and valuation figures for the company:
|
Measure (Trailing Twelve Months) |
Amount |
|
Enterprise Value / Sales |
1.4 |
|
Enterprise Value / EBITDA |
12.9 |
|
Price / Sales |
1.5 |
|
Revenue Growth Rate |
0.3% |
|
Net Income Margin |
7.3% |
|
EBITDA % |
10.8% |
|
Market Capitalization |
$6,080,000,000 |
|
Enterprise Value |
$6,830,000,000 |
|
Operating Cash Flow |
$443,000,000 |
|
Earnings Per Share (Fully Diluted) |
$5.95 |
|
2024 FWD EPS Estimate |
$6.96 |
|
Free Cash Flow Per Share |
$6.20 |
|
SA Quant Score |
Strong Buy – 4.58 |
(Source – Seeking Alpha.)
As a reference, a relevant partial public comparable would be Insperity:
|
Metric (Trailing Twelve Months) |
Insperity |
TriNet |
Variance |
|
Enterprise Value / Sales |
0.6 |
1.4 |
120.6% |
|
Enterprise Value / EBITDA |
14.5 |
12.9 |
-11.2% |
|
Revenue Growth Rate |
11.4% |
0.3% |
-97.8% |
|
Net Income Margin |
3.0% |
7.3% |
144.4% |
|
Operating Cash Flow |
$365,930,000 |
$443,000,000 |
21.1% |
(Source – Seeking Alpha.)
Commentary On TriNet
In its most recent earnings call (Source – Seeking Alpha), management’s prepared remarks highlighted increasing its service levels while reducing its overall spending.
Also, the firm’s retention rate is expected to equal its all-time best retention rate.
TriNet’s average contract value increased by 42% year-over-year, an impressive result.
The SMB sector suggested a “shift to optimism,” with a strong majority of SMB leaders more confident of their ability to handle the macro environment over the next twelve months.
I prepared a chart showing the frequency of a number of terms used by management and analysts:
Seeking Alpha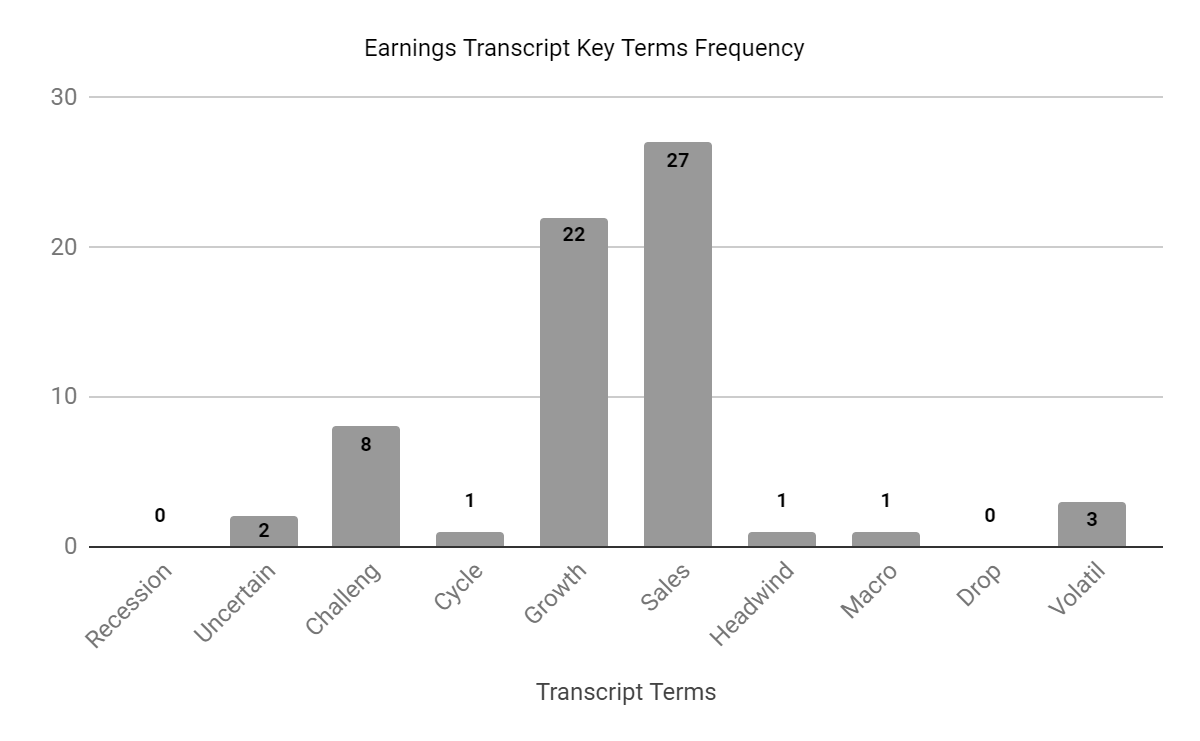
The firm faces “inconsistent” customer hiring among different industry verticals, with the important Technology industry showing “modestly weaker” hiring, while FinServ, Main Street and Life Sciences are producing stronger hiring growth.
Analysts questioned the leadership about volumes versus rates, capital allocation and improved deal closing rates.
Management replied that most of what they expect to see in Q4 2023 will come from volume growth rather than rate increases.
On capital return, the firm will target returning 75% of free cash flow to investors through buybacks or the potential for a recurring dividend in 2024.
Leadership said that the company has been closing deals at a higher rate due to greater number of referrals and its investments in technology.
For the quarter’s results, total revenue fell by 1.5% YoY while gross profit margin slid by 0.9%.
Selling and G&A expenses as a percentage of revenue increased by 0.3% year-over-year, and operating income dropped by 11.2%.
The company’s financial position is moderate, with plenty of liquidity but a significant amount of long-term debt. The firm generates a high amount of free cash flow.
Looking ahead, management guided full-year 2023 revenue to close out at 0.5% growth at the midpoint over 2022’s results.
If achieved, this would represent a decline in revenue growth rate versus 2022’s growth rate of 7.6% over 2021.
In the past twelve months, the firm’s EV/EBITDA valuation multiple has more than doubled, as the chart from Seeking Alpha shows below:
Seeking Alpha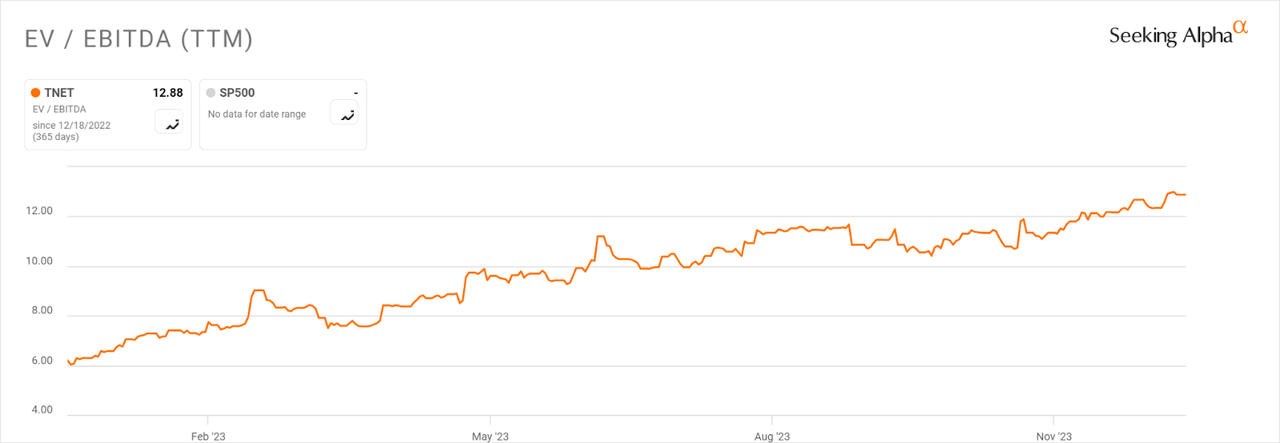
A potential upside catalyst to the stock could include stronger demand from its primary SMB segment, especially as cost of capital assumptions drop and credit availability increases, which favors smaller businesses.
TNET is managing costs well and is seeing an improved outlook from buyers as they look ahead.
Although TriNet Group, Inc. stock has performed very well in the past twelve months, I believe it has more room to rise, so my outlook is a Buy.
Credit: Source link