
Devrimb
Reality bites. Unless, of course, you’re a shareholder of the Gabelli Multimedia Fund (NYSE:GGT), $6.13 closing market price, and you can ignore the reality of your fund dropping -50% of its assets over the last three years.
But plenty of shareholders seem to be doing just that as GGT’s market price has ascended back to a 70%-plus market price premium over its current $3.62 NAV after GGT’s board of directors at GAMCO kicked the can down the road yet again on Nov. 16 when they kept GGT’s quarterly distribution at $0.22/share.
But let’s go back three years to when I first wrote about GGT so you can have some perspective of what has happened since then.
Here is the article from Nov. 13, 2020, Equity CEFs: Count Yourself Lucky If you Own GAB Or GGT, that first mentioned GAMCO paying out more than what their 10% NAV distribution policies called for, both for GGT and the Gabelli Equity Fund (GAB) too.
Now I suppose there’s nothing wrong with overpaying a fund’s distribution to keep your shareholders happy, but what happens when you keep doing that and your 10% NAV distribution amasses to a monster sized 24% NAV distribution, the highest of all CEFs.
I’ll tell you what happens and I said it in the article too. That there would be repercussions if a fund can’t cover its distribution, and the repercussion is a lower and lower NAV.
Brief Refresher Course On Distributions And Dividends
Remember, every stock, ETF, CEF and mutual fund when it goes ex-dividend is reduced by their distribution/dividend amount before it starts trading. And until it makes up that distribution or dividend, then it has not been earned.
And for CEFs, that means both the market price AND NAV are reduced by the distribution amount.
Now fixed-income funds can be different. They often accrue their interest and dividends over a period of time and then just pay out what has accrued. But their market prices still drop by the accrued interest or distribution amount before the start of trading on their ex-div date.
So when you hear about big, fat, juicy dividends and yields in stocks and funds and assume that’s separate from the market price performance, it’s not.
I can’t tell you how many times I’ve seen a CEF announce a big year-end capital gain distribution and shareholders get all excited and bid up the fund like it’s free money.
And unfortunately, I have to be the one to point out that you didn’t just win the lottery. And in fact, if you own the CEF in a taxable account, that’s one of the worst announcements you can hear as not only will your fund be deducted by the capital gain on the ex-date, you’re going to have to pay taxes on it!
So clearly, this is not an “everyone knows that” fact of how dividends and distributions work.
Reality In Graphs Going Back 3+ Years
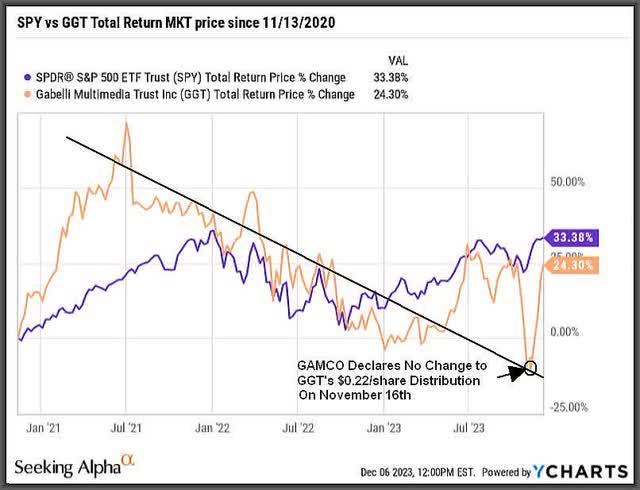
Getting back to my article on GGT from November of 2020, if you look at GGT’s total return market price since then, you might think that you’ve more or less kept up with the S&P 500 (SPY), $456.60 closing market price.
Y-Charts
But go back a month just before GAMCO made the $0.22/share distribution declaration on Nov. 16 and GGT was actually well into negative territory (see above). So clearly, there were shareholders who were worried about a distribution cut ahead of the last declaration.
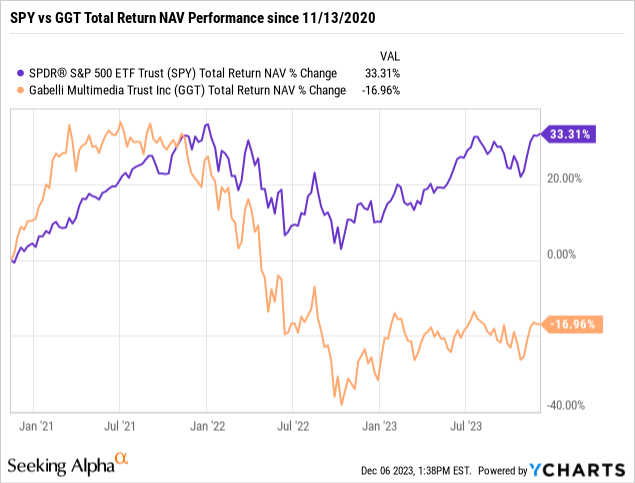
And well they should. Because if you graph GGT’s NAV total return over the same period, you can see that for a highly leveraged CEF that owned a mostly global equity portfolio of large and medium cap multimedia and telecommunication stocks, not exactly the worst sectors to be in since 2020 (MSCI ACWI Communication Services), GGT’s NAV is still well into negative territory even on a total return basis, i.e. including all distributions:
Y-Charts
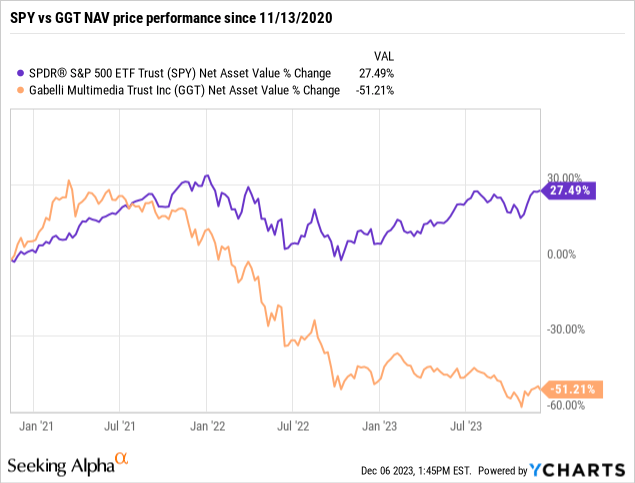
And if you look at GGT’s NAV just on a gross price performance basis, this is where GGT has lost –50% of its NAV over the last three years, from $7.30 when I wrote the article to $3.62 today:
Y-Charts
Note: GAMCO uses the MSCI ACWI Communication Services Index, a global large and mid-cap stock fund as GGT’s benchmark that was up +16.3% in 2020, +18.5% in 2021 and down -18.4% in 2022
These are just the facts and this is the reality of GGT, a fund that represents one of the worst risk/rewards I’ve ever seen in CEFs.
And those NAV performance figures don’t even include GGT’s 4-for-1 Rights Offering in July of 2021 which was priced at a significant premium to GGT’s NAV of $9.08/share at the time and thus, helped buffer GGT’s NAV.
Still, GGT’s NAV continued to go down and even today, is not that far from an all-time low NAV (see graph immediately above).
Conclusion
What drives me crazy is the fact that there are so many other equity CEFs that are actually covering their distributions and are growing their NAVs and yet, almost all of them trade at discounts, not 70% market price premiums.
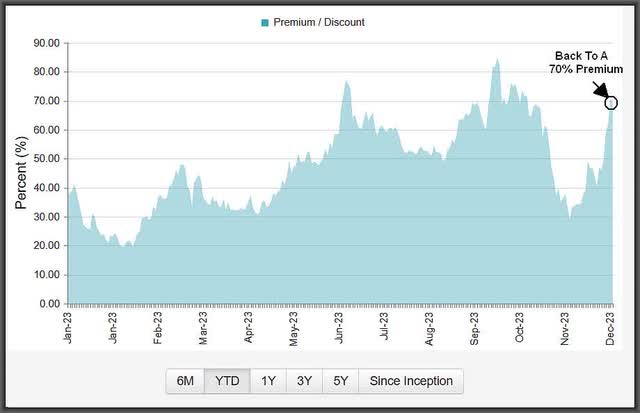
CEF Connect
How does this happen? How can you have such a blatant anomaly like this for a fund whose liquidation value is $3.62 and likely going lower, i.e. another $0.22/share will be removed on the Dec. 14 ex-date.
Well… 1). GGT is a very small fund now after losing so much of its assets over the years so it’s easier to move up and down, 2). GGT is highly leveraged, so that also contributes to its volatility in down and up markets.
But frankly, the biggest reason why GGT trades at such an absurd valuation is because GGT’s board of directors haven’t dealt with the elephant in the room and that has emboldened shareholders to believe their current 14.4% market yield is safe, even though that’s way less than what the fund actually pays out at a 24.3% NAV yield.
But what if GGT’s board of directors went back to a 10% distribution policy, which to me is the only way to stop GGT’s NAV erosion?
Well, here is a taste of what that would look like from GGT’s latest distribution declaration press release last month:
We note that 10% of the average net asset value of the Fund would be $0.39 based on the ending net asset values per share as of December 31, 2022, March 31, 2023, June 30, 2023, and September 30, 2023 of $3.89, $4.21, $4.05, and $3.45, respectively. In declaring a distribution of $0.22 per share, the Board of Directors has chosen to distribute $0.49 greater than that called for by the distribution policy. The net asset value per share fluctuates daily.
In other words, the TOTAL distribution for the year would be $0.39/share so if the Board of Directors set GGT’s distribution back to its normalized 10% NAV distribution policy, then GGT’s distribution would have been cut from $0.22/share per quarter to $0.975/share per quarter ($0.39/4).
And if you want to know what a reality check looks like in GGT, go back a month when at least someone was concerned about that happening.
Credit: Source link