

anyaberkut
I got to spend a good bit of time with my mom last week. That’s the positive side to what happened, and I’m not downplaying it.
We should never take our loved ones for granted. Because we never know when they’ll be gone.
My family was reminded of that after my aunt passed away. Hence the reason why I got to spend a good bit of time with my mom. We had a several-hours drive to the funeral and back on Friday.
The funeral, obviously, is the negative side. It’s never easy to lose a family member, no matter how many years they got to enjoy. And I know Mom really felt the loss.
Again, though, I am grateful for the long drive, especially because it meant I got to unexpectedly help her out. We started talking about income, and it turns out she has cash in her savings that she’d like to put to good use.
Now, with my mom, I know her exact situation.
I know her finances.
I know her risk tolerance.
I know how old she is, where she lives, her general spending expectations and responsibilities, and that she’s retired.
In which case, I have no problem giving her direct advice.
While I can’t completely predict the future, I can put my experience and expertise to good use for her.
Which is why I told her about four specific sleep-well-at-night stocks, or SWANs. It’s almost like they were custom-made for her.
Informing Investors Everywhere (Or as “Where” as I Can Reach)
The truth is that sleep-well-at-night stocks can be great picks for many retirees. That’s particularly true when said SWANs come with higher-than-usual dividend yields.
Which, of course, is the case with most real estate investment trusts, or REITs.
This isn’t to say that all REITs are SWANs, mind you.
I want to make myself very clear for anyone here who isn’t a regular reader. (And perhaps to remind anyone else who’s forgotten.)
REITs do tend to be more stable than a lot of other stocks.
They have to be considering the rule that says they must pay out 90% of their otherwise taxable income to their shareholders (and most pay out 100% of their taxable income).
This means they don’t have easy and abundant cash to throw around. It typically makes them a lot more cautious about how and where they spend their money – while still being mindful that their shareholders expect growth.
Even so, there are riskier REITs out there. And REIT stock prices can experience volatility regardless depending on the circumstances.
Right now, those circumstances include significant worries about commercial real estate in general, which – fairly or unfairly – have helped create a rough path forward for REITs in 2023.
With that said, this has led to extremely low entry price points for investors to capitalize on. Personally, I’m not going to complain about that, particularly when the REITs I already own keep paying out dividends.
That’s one overall factor I want you to consider before you put any money down on the portfolio possibilities I’m about to detail. You always want to know both the positive and negative aspects of any decisions, from taking a shortcut on your way to work to purchasing part of a company.
So that’s precisely what I’m trying to do: make you as informed an investor as possible.
You’re Not on Your Own, But It Is Up to You
Here’s another thing to consider. If I didn’t already make myself clear, I know my mother personally and closely.
As well I should.
The reason why I’m making such an obvious statement is to make a similarly obvious statement: that I don’t know you personally. Which, by definition, means I don’t know you closely.
Which, by definition – both in a legal and moral sense – means I have no business giving you personalized investment advice.
The research I provide below really is specifically tailored for my mother. However, there are plenty of others out there with very similar circumstances.
It’s up to you to decide whether you’re one of them.
To help you in figuring that out one way or the other, here’s how I describe SWANs in my Intelligent REIT Investor:
“They rarely provide the highest dividend yields or even necessarily the best total returns. And they’re not usually the type to trade at bargain prices. However, they are the type that provides years of 7%-8% total returns on average with only modest risk. You see, blue-chip REITs [also known as SWAN REITs] have certain qualities that set them apart, such as:
- Outstanding proven management that’s familiar with the demands of real estate ownership and operation, and the quirks of public markets
- A track record of effective deployment of available capital to create shareholder value
- Balance sheet strength and flexibility
- Sector focus and deep regional or local market expertise
- Conservative and intelligent dividend policy
- Good corporate governance
- Meaningful insider stock ownership.
“A blue-chip REIT doesn’t have to exhibit all those attributes at once. But it will have most of them.”
That makes SWANs steady, staid, “boring” investments overall that I, for one, see definite benefits in. And I know my mother will too.
My 4 REIT Picks for Mom
Realty Income Corporation (O)
When writing on blue-chip REIT SWANs I think it’s only fair to start with Realty Income, which is maybe the epitome of a SWAN stock.
Realty Income is a S&P 500 (SP500) company and a Dividend Aristocrat that has been paying monthly dividends since its formation in 1969 and has increased its dividend each year for 29 consecutive years.
The company went public in 1994, and since that time it has declared 641 consecutive monthly dividends and raised the dividend 122 times and for 104 consecutive quarters. Realty Income’s ability to consistently deliver income to its shareholders is supported by the rent checks it receives from more than 13,000 commercial real estate properties.
The company is a net-lease REIT that invests in single-tenant, free-standing commercial real estate across all 50 states as well as internationally, with properties located in the United Kingdom, Spain, Italy, and Ireland.
O – IR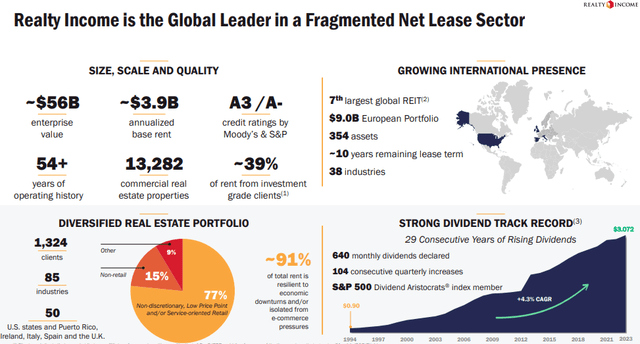
Realty Income’s portfolio is comprised of approximately 13,282 commercial properties covering roughly 263 million square feet, which are leased to over 1,300 tenants on a triple-net basis.
The company has a very defensive net-lease business model, as it targets properties used by tenants in industries that are resistant to ecommerce and recession, such as discount retailers and retailers that provide necessity-based goods and services.
Realty Income’s top 5 industries includes grocery stores, convenience stores, dollar stores, drug stores, and home improvement.
As a percentage of their annualized contractual rent, grocery stores make up 11.4%, convenience stores make up 10.6%, dollar stores make up 7.2%, drug stores make up 5.9%, and home improvement stores makes up 5.8% of their annual rent.
As of the end of the third quarter, Realty Income’s portfolio had a physical occupancy of 98.8% and a weighted average remaining lease term of approximately 9.7 years.
O – IR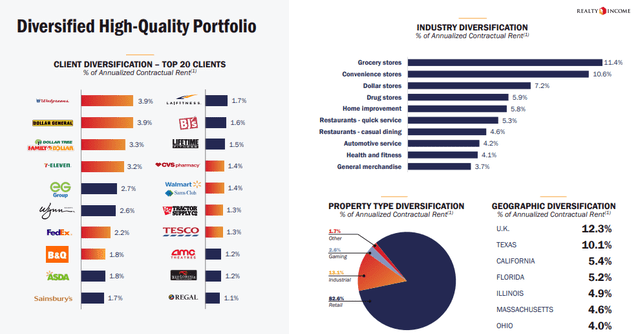
Realty Income is also a SWAN due to its investment-grade balance sheet. The company has an A- credit rating from S&P Global and solid debt metrics, including a net debt to pro forma adjusted EBITDAre of 5.2x, a long-term debt to capital ratio of 39.81%, and a fixed charge coverage ratio of 4.5x.
At 96%, the majority of their debt is unsecured, and 93% of their debt is fixed rate. Their debt maturities are well-staggered with a weighted average term to maturity of 6.6 years. As of the end of the third quarter, the company reported total liquidity of $4.5 billion.
O – IR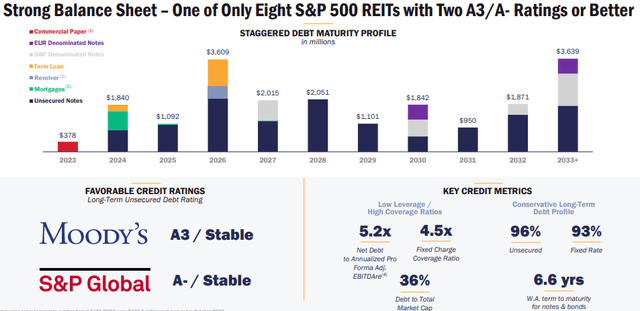
Realty Income could be considered the ultimate SWAN, as it has delivered positive adjusted funds from operations, or AFFO, per share growth in 26 out of the last 27 years and has delivered a median AFFO growth rate of roughly 5% since 1996.
They have paid uninterrupted dividends throughout their 54-year operating history and have increased their monthly distribution for 29 consecutive years.
Realty Income pays a 5.53% dividend yield that is well-covered with a 2022 year-end AFFO payout ratio of 75.69% and currently trades at a P/AFFO of 13.90x, compared to their 10-year average AFFO multiple of 18.86x.
We rate Realty Income stock a Buy.
FAST Graphs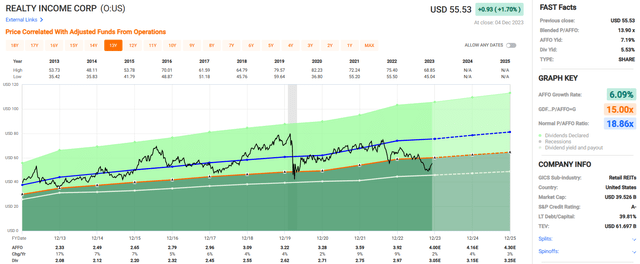
Agree Realty Corporation (ADC)
Agree Realty is a net-lease REIT that specializes in the development, acquisition, and management of high-quality retail properties. ADC’s portfolio is comprised of 2,084 commercial retail properties that cover more than 43.0 million SF and are located across 49 states.
ADC’s has a high-quality tenant base that includes well regarded names such as Walmart, Tractor Supply, Dollar General, Kroger, Lowe’s, 7-Eleven, and Home Depot. In total 68.9% of their annualized base rent (“ABR”) comes from investment-grade tenants.
Agree Realty targets retail sectors that are insulated from ecommerce and recession with defensive industries such as grocery stores, home improvement, auto repair, and convenience stores.
ADC’s top retail sector is grocery stores, which makes up 9.7% of their ABR, followed by home improvement and auto repair, which makes up 8.6% and 8.5% respectively.
At the end of the third quarter, ADC’s portfolio was 99.7% leased, with a weighted average remaining lease term of roughly 8.6 years.
ADC – IR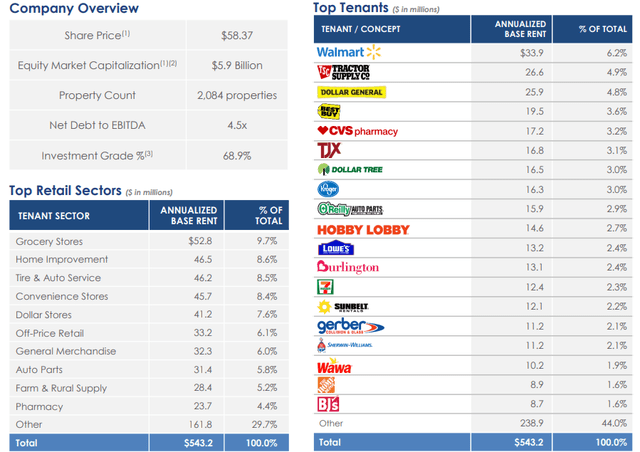
Unlike many of its net-lease peers, Agree Realty has a ground-lease portfolio that consists of 217 leases with a weighted-average lease term of 10.8 years.
As a percentage of their ground-lease portfolio’s ABR, their largest tenant is Lowe’s at 13%, followed by Wawa and Walmart, which made up 13% and 12%, respectively.
ADC’s ground-lease portfolio has excellent creditworthy tenants, and 88% of their ground-lease ABR comes from investment-grade tenants. As of their latest update, ADC’s ground-lease portfolio makes up approximately 12% of their total portfolio’s ABR.
ADC – IR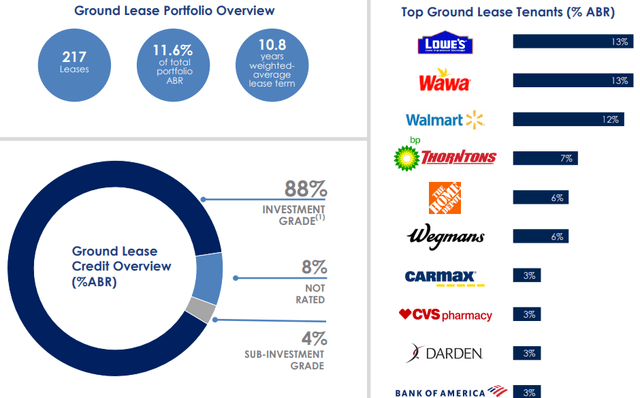
ADC is investment grade with a BBB credit rating from S&P Global and has a fortress balance sheet with a net debt to EBITDA of 4.5x, a long-term debt to capital ratio of 30.42%, and a fixed charge coverage ratio of 5.1x.
ADC’s debt maturity schedule is well staggered with no material debt maturities until 2028 and a weighted average term to maturity of approximately 7 years.
ADC – IR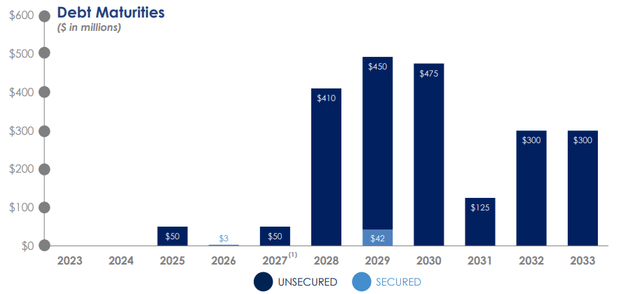
Over the past 10 years ADC has had a blended average AFFO growth rate of 5.52% and an average dividend growth rate of 5.79%.
The company’s operating results have been very consistent, with positive AFFO per share growth in each year since 2013 as well as dividend growth in each year over the past decade.
ADC pays a 4.82% dividend yield that is well covered, with a 2022 year-end AFFO payout ratio of 73.24%. It currently trades at a P/AFFO of 15.55x, compared to its 10-year average AFFO multiple of 17.76x.
We rate Agree Realty stock a Buy.
FAST Graphs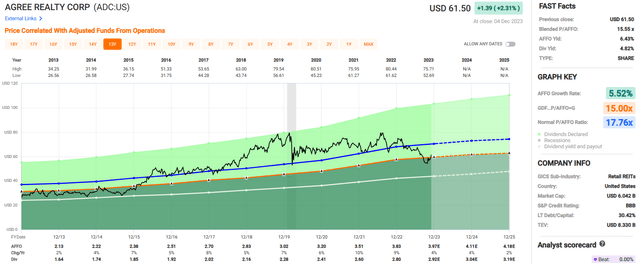
VICI Properties Inc. (VICI)
Like the two REITs previously discussed, VICI is a net-lease REIT that structures its leases on a long-term, triple-net basis. However, unlike the previous two net-lease companies, VICI has a specialized focus on experiential real estate which consists of both gaming and non-gaming properties.
VICI owns 92 experiential assets that consist of 54 gaming properties and 38 non-gaming experiential properties located across 26 states and Canada.
Their gaming portfolio consists of 54 properties that feature more than 60,000 hotel rooms, approximately 500 retail outlets, and around 500 restaurants, nightclubs, sportsbooks and bars.
Some of the more notable properties in VICI’s gaming portfolio includes several trophy properties located on the Las Vegas Strip, such as Caesars Palace, MGM Grand, and the Mirage.
VICI’s non-gaming experiential properties consist of 38 family entertainment centers (bowling alleys) that VICI acquired from Bowlero in October. Additionally, VICI owns 4 championship golf courses and more than 30 acres of developable land next to the Las Vegas Strip.
VICI – IR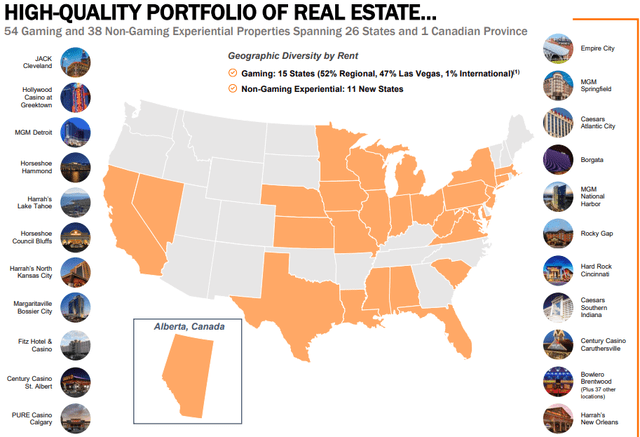
VICI has 12 tenants, but the vast majority of its rent comes from its top 2 tenants: Caesars and MGM Resorts. Approximately 39% of VICI’s annualized cash rent comes from Caesars, while 35% comes from MGM Resorts.
When including all tenant renewal options, VICI’s tenants have extremely long weighted average lease terms (“WALT”) with Caesars having a WALT of 31.9 years and MGM Resorts having a WALT of 51.5 years.
While VICI has high tenant concentration, they also have a 100% occupancy rate. The gaming regulatory environment creates high-barriers to entry and makes it very difficult for gaming operators to move locations, giving a “stickiness” to VICI’s properties.
Additionally, as previously mentioned, VICI owns several iconic trophy properties that could not be easily replaced. In this instance, I’m not concerned about VICI’s tenant concentration.
VICI – IR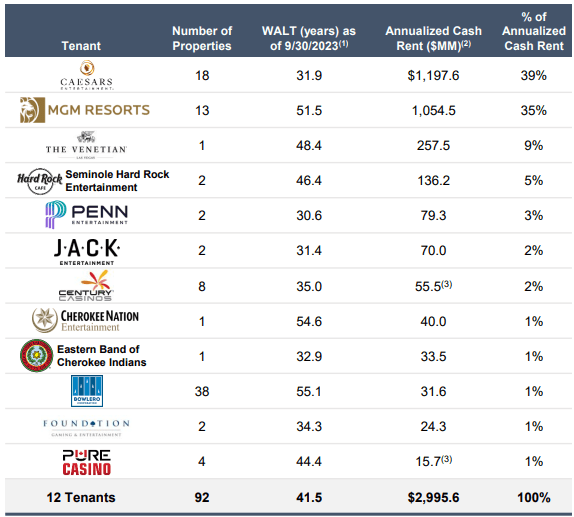
VICI has an investment-grade balance sheet with a BBB- credit rating from S&P Global and sound debt metrics, including a net leverage ratio of 5.7x, a long-term debt to capital ratio of 42.02%, and an EBITDA to interest expense ratio of 4.11x.
Practically all of their debt (99%) is fixed rate and has a weighted average term to maturity of 6.1 years. Since 2019, VICI has delivered a blended average AFFO growth rate of 7.23% and an average dividend growth rate of 10.80%.
VICI pays a 5.43% dividend yield that is well covered, with a 2022 year-end AFFO payout ratio of 77.72%. It is currently trading at a P/AFFO of 14.32x, compared to their average AFFO multiple of 16.29x.
We rate VICI Properties stock a Buy.
FAST Graphs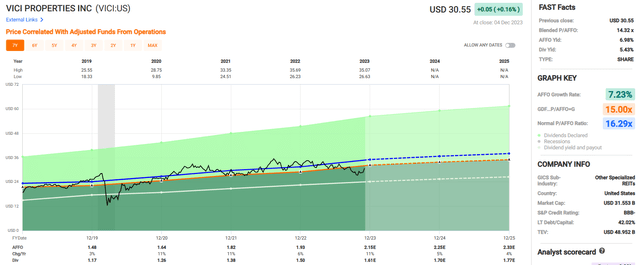
Mid-America Apartment Communities, Inc. (MAA)
Mid-America is multifamily REIT that specializes in the development, acquisition, and management of multifamily apartment communities that are predominantly located in the Sunbelt region of the country.
MAA’s apartment communities are located in 16 states and the District of Columbia and contain almost 102,000 apartment homes with an average physical occupancy rate of 95.7% as of the end of the third quarter. MAA invests in a variety of apartments communities that range in both class and style.
The majority of their portfolio (54%) consists of Class A- / B+ apartments, 33% is made up of Class A+ / A apartments, and 13% is made up of Class B / B- apartments.
In terms of apartment style, MAA offers garden style apartments that are 3 stories or less, mid-rise apartments that are 4 to 9 stories, and high-rise apartments that are 10 or more stories. 62% of MAA’s portfolio consists of garden style apartments, 34% consists of mid-rise apartments, and 4% of their portfolio consists of high-rise apartments.
MAA’s strategic focus on the Sunbelt markets is apparent from the chart below which provides a list of MAA’s top 10 markets. When measured by same-store net operating income (“NOI”), their largest 3 markets are Atlanta at 12.7%, Dallas at 10.0%, and Tampa at 6.9%.
MAA – IR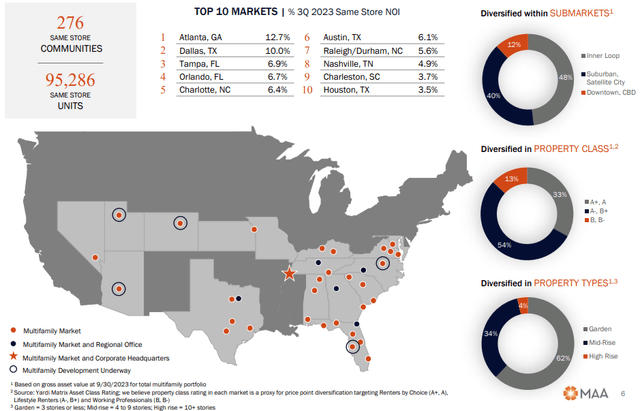
Similar to all the previous companies discussed, MAA has an excellent dividend track record. Its quarterly dividend has never been suspended or reduced since their public listing in 1994.
MAA has not increased its dividend each year, but they have either raised or maintained it over the past 29 years and have made 119 consecutive quarterly dividend payments over this period.
MAA – IR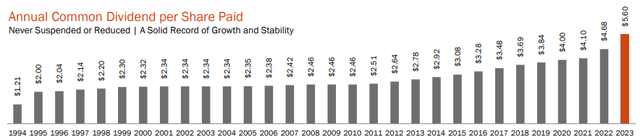
We like MAA’s Sunbelt exposure as migration trends continue to favor this region. We also like MAA’s impeccable balance sheet and debt metrics. MAA is investment-grade with an A- credit rating from S&P Global.
They have a net debt to adjusted EBITDAre of 3.4x, a total debt to adjusted total assets ratio of 27.3%, and an EBITDA to interest expense ratio of 8.42x. Their debt is 100% fixed rate, with a weighted average interest rate of 3.4% and a weighted average term to maturity of 7.2 years.
Over the past decade, MAA has delivered a blended average AFFO growth rate of 6.27% and an average dividend growth rate of 5.92%.
The apartment REIT pays a 4.42% dividend yield that is well-covered with a 2022 year-end AFFO payout ratio of 60.95% and is currently trading at a P/AFFO of 15.44x, compared to its 10-year average AFFO multiple of 19.18x.
We rate Mid-America Apartment stock a Strong Buy.
FAST Graphs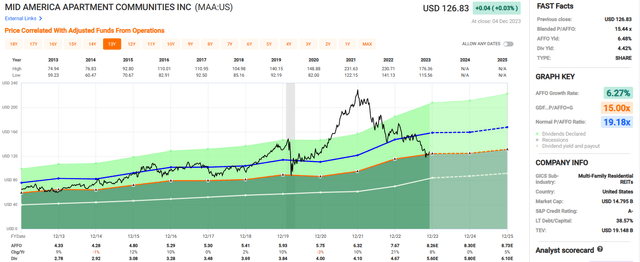
In Closing
I just taught a class at Clemson University yesterday, and I told the class about these picks for mom. I explained to these eager real estate students that these REITs aren’t just for my mom, but also for Gen Z’ers.
I explained the power of compounding to the class and the potential for enhancing wealth by maintaining a disciplined long-term mindset.
I hope you enjoyed this article and I think mom will really like these picks too.
Happy Holidays!
@rbradthomas
Credit: Source link