

Andrii Dodonov
The Pains Of Being Early
When I last wrote about the Nuveen Quality Municipal Income Fund (NYSE:NAD) six months ago, the closed end fund had been suffering though a couple years of price declines and dividend cuts due to a rising interest rate environment. However, by June 2023, I thought “The Pain May Be Over Soon” as the rate hiking cycle appeared to be near the end. That prediction was a bit early, as interest rates for most maturities on the treasury yield curve did not peak until 10/25/2023. On that day, NAD hit its lowest close since the 2008 financial crisis at $9.57, over 13% off where it traded at the time my last article was published. Since then, the fund has round-tripped that decline, and now trades back where it did in early June.
Seeking Alpha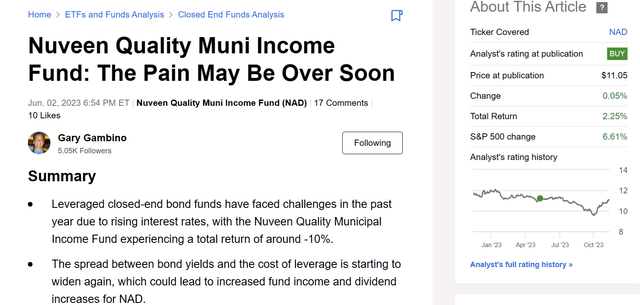
Looking At Alternatives
Common advice from some closed end fund analysts on Seeking Alpha is to not worry about these price declines and focus on the income as long as the quality of the holdings is intact. That is fine as long as the cost of leverage does not cut into the fund’s earnings and necessitate a dividend cut. That was unfortunately the case with NAD which suffered cuts from $0.0595 to $0.038 between June 2022 and October 2023, a 36% decline. The recent increase to $0.044 is not because the funds earnings have improved that much yet, but because Nuveen changed its distribution policy, allowing coverage to drop further below 100% than they did in the past.
NAD monthly dividend (Seeking Alpha)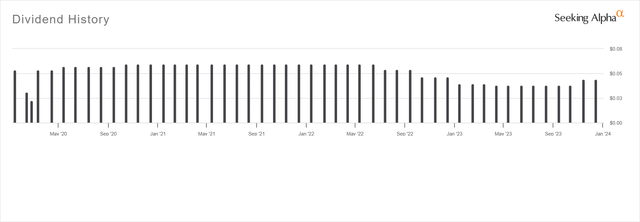
Leverage is a double-edged sword. When the yield spread between the fund’s holdings and the cost of leverage is widening, it magnifies returns. However if this spread is narrowing it can magnify losses. I showed that in my last article with a graph of NAD’s monthly earnings vs. the spread between 20-year munis and 2-year treasuries, commonly available market data that correlates well. Here is an updated version of that chart. Most of the new points unfortunately fall in the lower left, where the spread is negative and NAD EPS is below the current dividend payout of $0.044.
Author Spreadsheet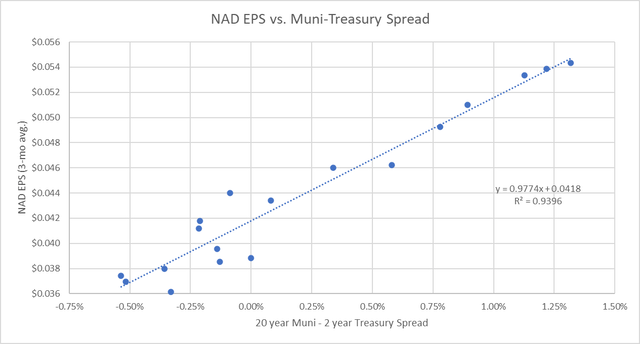
I continue to have conviction that rates will come down soon and the spread will widen again, increasing the earning power of NAD. However, it is worth looking at other funds to see how much advantage leverage really adds over the long term. Nuveen offers a wide array of closed end muni funds, including 6 national investment grade funds and 5 national high yield funds. They also offer several state-specific funds, which I omitted from the table below for clarity.
Nuveen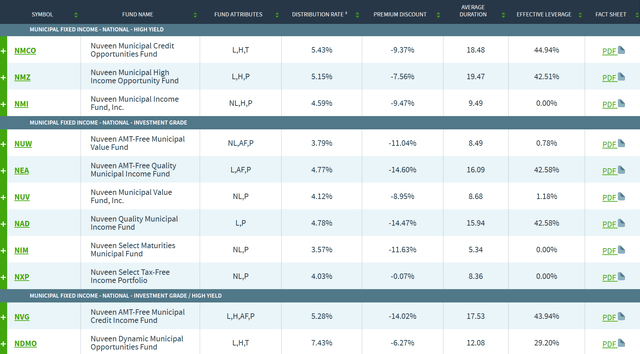
As you can see, leverage ranges from zero to high (low 40’s percent like NAD). Duration also varies. Like leverage, it can magnify the price change of a fund when the interest rate environment is changing. There are also differences in quality of holdings, even within a single category like “investment grade”.
For example, the Nuveen Select Tax-Free Income Portfolio (NYSE:NXP) differs considerably from NAD on all three of these variables. Let’s look at the differences and see how each one performs in different interest rate environments.
Leverage
NAD employs leverage through the use of two different types of variable rate preferred shares and tender option bonds (Definitions available on Nuveen’s website).
NAD Capital Structure (Nuveen)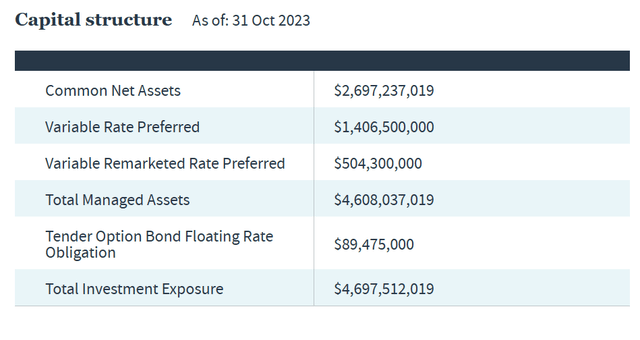
As stated on the fund page, NXP may use tender option bonds to create up to 10% leverage. Currently, the fund has zero leverage, however.
Duration
Duration measures the sensitivity of a fund’s holdings to moves in interest rates. A rule of thumb is that if a fund has a duration of n years, a 1% increase in interest rates will cause the net asset value of the fund to decrease n%.
NAD has the second highest leverage-adjusted duration among Nuveen’s investment grade national muni CEFs at 15.94 years. Looking at the fund’s holdings, half of them have a maturity in the 20-29 year range.
NAD Maturity Profile (Nuveen)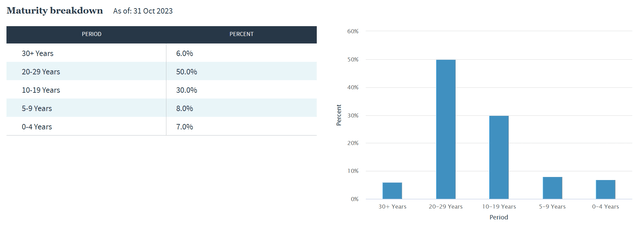
NXP has the second lowest duration of the group at 8.36 years. Its largest maturity category is the 10-19 year range.
NXP Maturity Profile (Nuveen)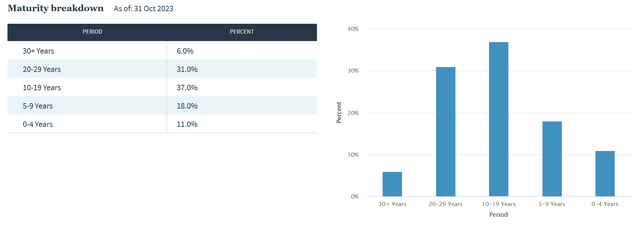
Quality
Despite the word “Quality” appearing in the name of the fund, NAD has lower quality holdings than NXP. NAD has 68.1% of holdings rated A or better and 4.7% rated BB or worse.
NAD Credit Quality Profile (Nuveen)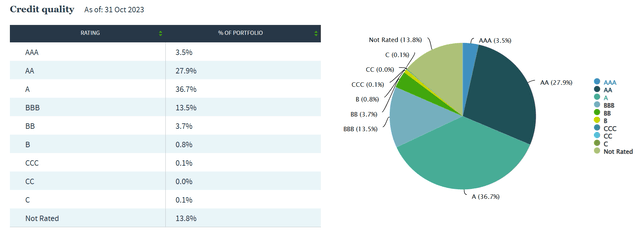
NXP has 86.4% of holdings rated A or better and 2.2% rated BB or worse.
NXP Credit Quality Profile (Nuveen)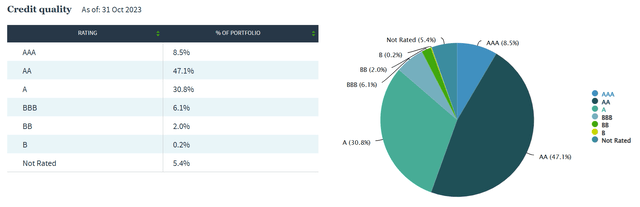
Performance Comparison
The leverage and duration serve NAD well at the start of declining interest rate period. Since the peak in rates on 10/25/2023, NAD has been the clear winner. (The iShares National Muni Bond ETF (MUB) is also included for those interested in a low-fee ETF as opposed to a CEF.)
Performance since 10/25/2023 (Seeking Alpha)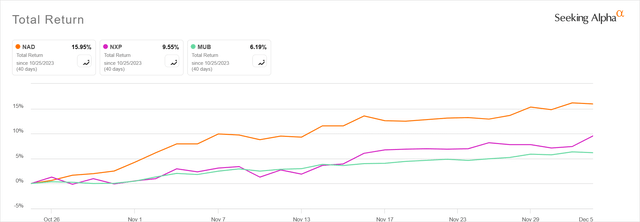
Since this is a short period of time, let’s look at the previous low-rate environment. This chart runs from 12/24/2018 (the bottom of the market panic at the end of the 2018 Fed hiking cycle) to 7/31/2021 (the last bottom for treasury rates not counting the ultra-low covid influenced rates of 2020).
This chart was unexpected. NAD initially outperforms for a few months at the start of the cycle, but then runs even with NXP for most of the cycle until one month at the very end. (Note the divergence in February 2020 right before the covid crash and again in July 2021.)
Total Return 12/24/2018 – 7/31/2021 (Seeking Alpha)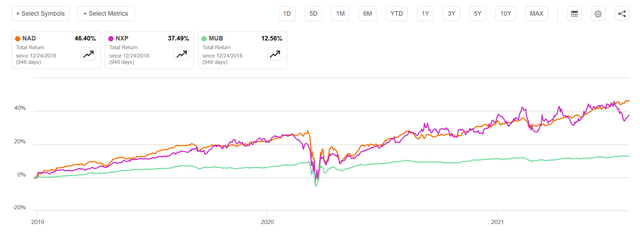
While it’s possible to spot a rate cutting cycle and trade into NAD for a few months’ outperformance, it is more difficult to know when the cycle is ending and trade out of NAD into NXP.
In a rate hiking cycle, such as the one from August 2021 until 10/25/2023, we see that NAD and NXP performed in line with each other for the first year although NAD was more volatile. (A passive ETF like MUB did even better, and of course cash would have been a good option as well). After the first year, NXP was the clear winner as lower leverage, duration and higher quality were all favored in a high-rate environment where recession fears existed.
Total Return 8/1/2021 – 10/25/2023 (Nuveen)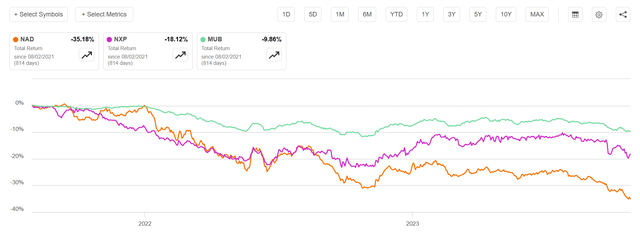
Looking over the long term, we see that the two CEF’s had similar total return performance since the pre-financial crisis market peak in October 2007. NAD did much worse during the financial crisis as leverage and lower quality both hurt performance. In the benign interest rate environment that ran from 2009 all the way to 2021, NAD recouped the financial crisis declines and then some. Unfortunately, it gave up all that outperformance in the rising rate environment we have had since then.
Total Return 10/1/2007 – 12/5/2023 (Seeking Alpha)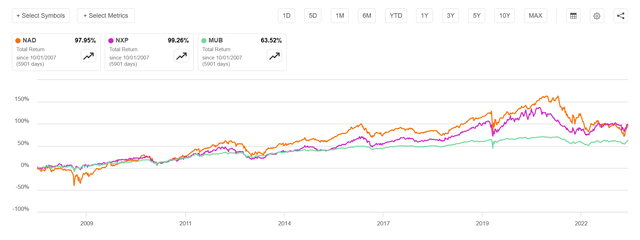
Finally, while I focus mainly on total return, yield is important to income investors. NAD has the higher yield at 4.8%, but as shown in the first chart of the article, it has suffered several distribution cuts since mid-2022. NXP on the other hand had cuts back in 2014 and 2015 but none in the current rate hiking cycle. The fund even increased its monthly dividend in January 2023. Nevertheless, the yield is lower at 4.05%.
Seeking Alpha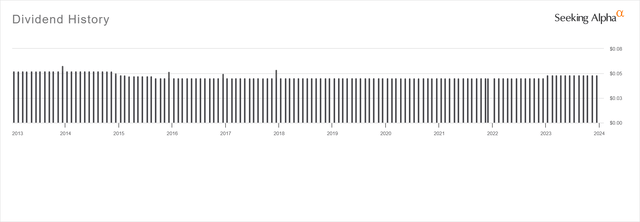
Which Fund Is Best?
As we see from the long term chart, the two funds can produce similar total returns over long periods if bought and held with dividends reinvested. The choice depends on investor wants and needs. Those not looking to maximize income but seek stability in dividends and share price would be better off with NXP. Investors who want more income and don’t mind the added volatility can go with NAD.
Investors who are “seeking alpha” and want to generate it through tactical trading based on market conditions may consider trades based on the 2×2 matrix below:
| Rates Rising | Rates Falling | |
| Economy Improving | NXP | NAD |
| Economy Declining | Cash | NXP |
NAD is the winner when rates are falling and the economy is doing well. The leverage and duration boost performance, and the lower quality does not hurt when times are good. If rates are falling but the economy appears headed into recession, NXP has the edge because of its higher quality. NXP should also win in a benign economy where rates are increasing due to its lower leverage and duration. If we have high rates and a worsening economy, I would rather be in cash than either fund.
Conclusion
Leverage can magnify performance on both the upside and downside, generating higher income but at the cost of higher volatility. Over the very long term covering at least one full economic cycle, there is surprisingly little difference in total return between a highly levered fund like NAD and an unlevered one like NXP. Which fund is best really depends on one’s economic outlook.
Personally, I expect a soft landing scenario where rates come down without a significant recession. For that reason, I will continue to hold NAD. However, at some point in the future if a recession appears likely or rates look like they will rise again, I would consider swapping into NXP.
Credit: Source link