

Lea Scaddan/iStock via Getty Images
Welcome to another installment of our BDC Market Weekly Review, where we discuss market activity in the Business Development Company (“BDC”) sector from both the bottom-up – highlighting individual news and events – as well as the top-down – providing an overview of the broader market.
We also try to add some historical context as well as relevant themes that look to be driving the market or that investors ought to be mindful of. This update covers the period through the third week of November.
Market Action
BDCs had another good week with a total return of around 1%. It was the best-performing sector across the income space we track. A continued rally in stocks and good Q3 results are supporting BDCs.
Systematic Income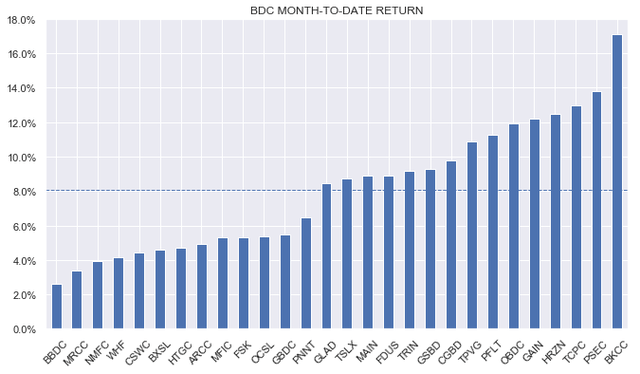
Year-to-date, BDCs are the second-best performing sector after MLPs.
Systematic Income BDC Tool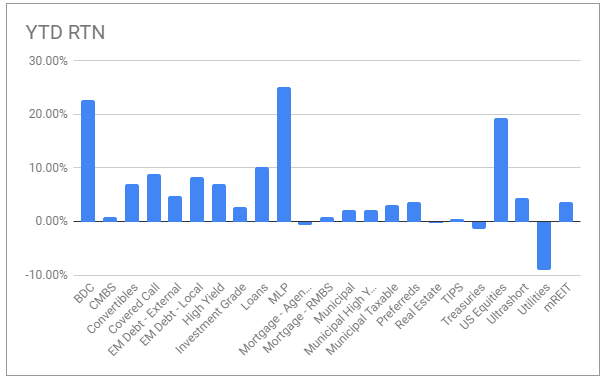
BDCs have almost fully recovered from the valuation drop off their recent peak. The average valuation in our coverage has moved up above 100%, roughly in line with the historic average.
Systematic Income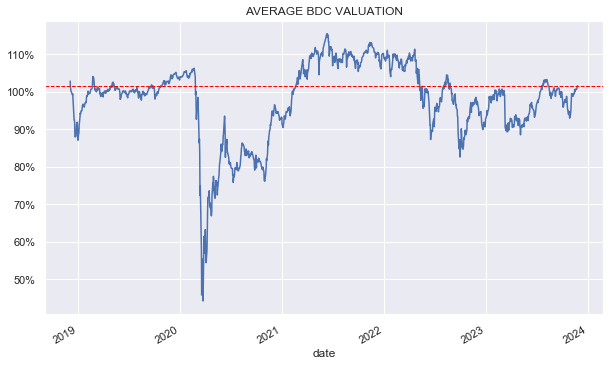
Market Themes
As BDC investors know, BDCs are not all the same. One of the key dimensions in which they vary is the part of the market they focus on. Larger BDCs such as BXSL, OBDC, ARCC, OCSL and others focus on the so-called upper middle-market, or companies with EBITDA above roughly $50-100mm, while other BDCs such as CSWC, FDUS, PNNT and others focus on smaller companies with EBITDA in the $10-50m range.
Much of this dynamic is simply due to the size of the BDCs – larger BDCs focus on larger companies and smaller BDCs focus on smaller companies. This is because smaller borrowers look for small loans and larger borrowers look for larger loans. It wouldn’t make much sense for a larger BDC to focus on lower middle-market companies and vice-versa. A tiny loan for a large BDC requires much the same due diligence as a larger loan but probably wouldn’t move the needle in terms of portfolio allocation. At the same time a smaller BDC is unlikely to be able to stump up the capital to offer a big enough loan to a larger borrower.
What’s interesting, however, is that some BDCs also try to defend their area of the middle-market space. For example, BXSL (a large BDC focusing on the upper middle-market space) has this chart in their latest quarterly presentation which shows that larger companies have a roughly similar spread on loans per turn of net leverage but a much lower default rate and a higher level of earnings growth.
BXSL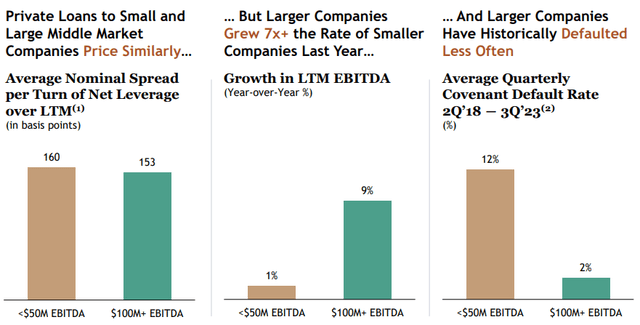
PNNT, on the other hand, shows that loans to smaller companies have a much higher yield on loans (1-1.5% higher on first-lien loans and more on second-lien loans) and lower risk in the form of lower leverage and better covenants.
PNNT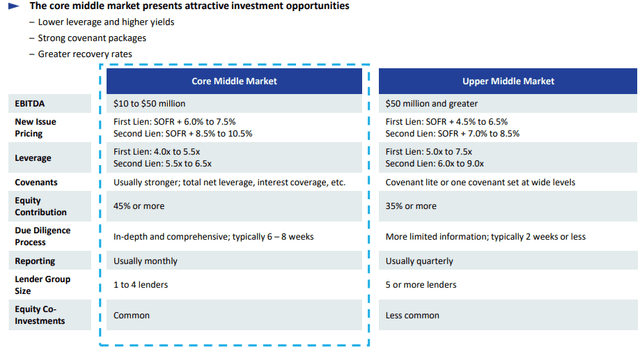
These sound like very different messages, so what’s going on? One answer is that the definitions do not quite line up. PNNT uses $50m+ as the upper middle-market whereas BXSL uses $100m+.
Two, PNNT uses data from the National Center For the Middle Market and Refinitiv while BXSL uses the Lincoln International Private Market Database.
Three, the metrics don’t line up. PNNT is focused on yield, leverage and covenants for first-lien and second-lien separately while BXSL is focused on spread per turn of leverage and default rate for the two types of loans together.
All in all, the BDCs are obviously going to cherry pick the numbers that suit them. A smaller BDC is not going to be an upper middle-market lender and vice-versa even if the numbers supported that investment case. Apart from the pure mechanics of lending, both parts of the middle-market allow for strong returns. For instance, lower and core-middle market lenders like FDUS and CSWC have put up very strong performance numbers as have many of their upper middle-market counterparts. We can also find lenders in both areas that have not performed well.
Ultimately, BDCs can do well in both parts of the market so investors shouldn’t necessarily focus on one area just because of what they see in a BDC presentation. It might make sense, however, to consider diversifying a BDC portfolio along this dimension just as investors diversify their BDC exposure across other dimensions such as portfolio allocation (e.g. first-lien vs. second-lien / equity etc.) and industry sectors.
Market Commentary
Blackstone Secured Lending (BXSL) reported good results for a total NAV return of 4% during the quarter or roughly in the middle of the pack so far this quarter. The NAV rose close to 1% due to a high level of retained income. Net income did fall, however that was largely due to a sizable share issuance that hasn’t yet been put to work. Non-accruals remained close to zero. BXSL is trading at a valuation of 108% which is 6% above the median BDC and is on the expensive side historically.
The Golub BDC (GBDC) had a good Q3. Net income rose 13% – due to a combination of higher base rates as well as the company’s management fee reduction to 1%.
Systematic Income BDC Tool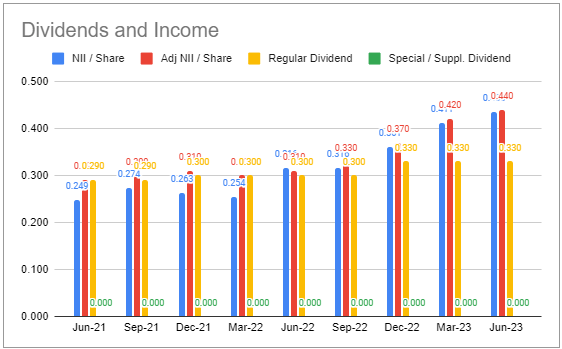
A base dividend of $0.37 was declared – a 12% increase. The company also declared a $0.07 supplemental. We won’t see similarly large dividends and net income increases going forward as the management fee decrease is non-repeatable. GBDC has now moved to trade on par with the sector valuation which is pretty unusual in the last couple of years and is no longer a slam dunk allocation as it was back then.
Systematic Income BDC Tool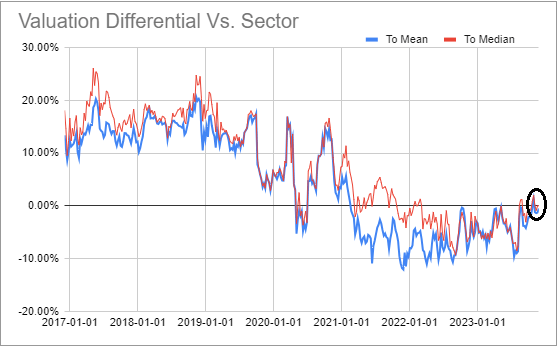
Overall, BDCs continue to deliver strong earnings. If risk appetite holds up well, we should see a bumper Q4 as deal seasonality kicks in and leads to a bump in prepayment fee income across the sector. BDCs such as ARCC and TSLX (pictured below) could be big beneficiaries of this dynamic.
Systematic Income BDC Tool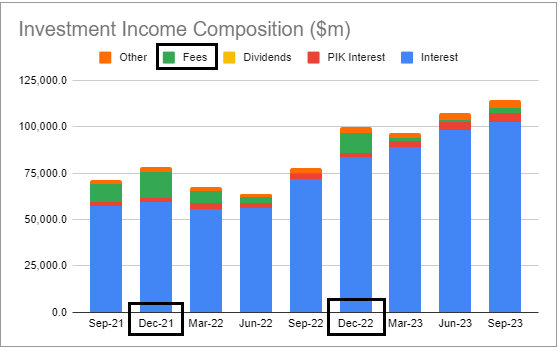
Credit: Source link