

BackyardProduction/iStock via Getty Images
Continuing my series of sentiment and factor updates on exchange-traded funds, today I would like to reassess the iShares Russell 1000 Value ETF (NYSEARCA:IWD), which I previously covered in July 2021 with a Hold rating.
For me, as a quality and value-focused investor (I certainly appreciate an adequate dose of growth, but only when other essential factors are nicely balanced), the three main points of concern were 1) the simplicity of the fund’s strategy, which made it prone to misinterpretations of a stock’s value profile, 2) a too-small share of companies with an attractive Seeking Alpha Quant Valuation rating, and 3) the somewhat soft returns IWD delivered in the past.
Since then, this portfolio has been recalibrated a few times, with about 8.5% of the holdings present in the July 2021 version removed. Even though the fund was mostly successful in countering bearish forces in 2022, delivering a double-digit alpha, its returns this year leave a lot to be desired, so since the previous note, it has underperformed the S&P 500.
Seeking Alpha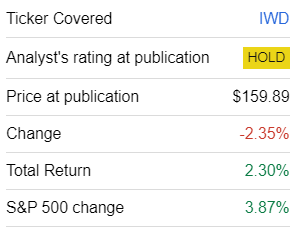
Today’s article is supposed to express concerns similar to those summarized above but based on fresh data.
The strategy’s simplicity hinders IWD from delivering a better-valued mix
According to its website, the basis of IWD’s strategy is the Russell 1000 Value Index, which it has been tracking since its inception in May 2000. As I discussed in the previous note, the methodology of this index is rather the opposite of highly selective. It does rely on a composite value score (as per the methodology document available on the LSEG website), which might sound a bit sophisticated upon cursory view. But as described in the prospectus:
The Underlying Index is a subset of the Russell 1000® Index… The Underlying Index measures the performance of equity securities of Russell 1000 Index issuers with lower price-to-book ratios, lower sales-per share historical growth and lower forecasted growth relative to all issuers whose securities are included in the Russell 1000 Index.
So this score incorporates only one valuation ratio, Price/Book, also ignoring natural differences existing between industries (i.e., financials are solidly cheaper than IT, etc.). I am not comfortable with this simplicity. Let me illustrate why this approach is vulnerable with the example of earnings yield and EV/EBITDA.
As of November 27, IWD had a portfolio of 848 equities, with financials being the top sector with a 21.3% weight, in contrast to the IT-heavy iShares Russell 1000 ETF (IWB). As financials tend to trade at modest P/Es, IWD’s earnings yield of 5.6% does not come as a surprise; certainly, this is a solid result for a fund with a weighted-average market cap of $137.9 billion. It is worth noting that the yield I calculated is based on the net profit and market capitalization, with negative figures included. It seems the fund’s methodology is a bit different from mine, as its website shows a P/E of 15.45x, which translates into an even stronger EY of 6.5%. At the same time, IWB displays a P/E of 22.2x (which implies a 4.5% EY).
| Metric | 27-Nov |
| Market Cap | $137.94 billion |
| EY | 5.61% |
| P/S | 3.27 |
| EPS Fwd | 6.11% |
| Revenue Fwd | 6.22% |
| ROE | 16.05% |
| ROA | 5.97% |
Calculated by the author using data from Seeking Alpha and the fund. Based on the financial data as of November 28
However, this is just the tip of the iceberg. Let us look at what a different multiple, most suitable for capital-intensive and debt-heavy businesses, can tell. The following table compiles the trailing twelve twelve months Enterprise Value/EBITDA ratios for all the sectors IWD has exposure to except for financials.
| Sector | Portfolio Median EV/EBITDA | Sector Median EV/EBITDA |
| Communication | 13.13 | 8.37 |
| Consumer Discretionary | 12.44 | 10.43 |
| Consumer Staples | 13.24 | 12.21 |
| Energy | 9.83 | 5.69 |
| Health Care | 12.45 | 14.17 |
| Industrials | 12.57 | 11.96 |
| Information Technology | 12.76 | 15.28 |
| Materials | 12.76 | 8.59 |
| Real Estate | 12.37 | 16.03 |
| Utilities | 13.04 | 12.02 |
Calculated using data from Seeking Alpha and the fund
This table essentially ruins the hypothesis of IWD’s strong value characteristics, as the medians for its holdings are mostly above the actual sector medians, with the exception being only IT, healthcare, and real estate. A nice example is Cisco Systems (CSCO), the ETF’s largest position in the IT sector (1% weight), which has a 9.92x EV/EBITDA vs. the sector median of 15.28x.
Seeking Alpha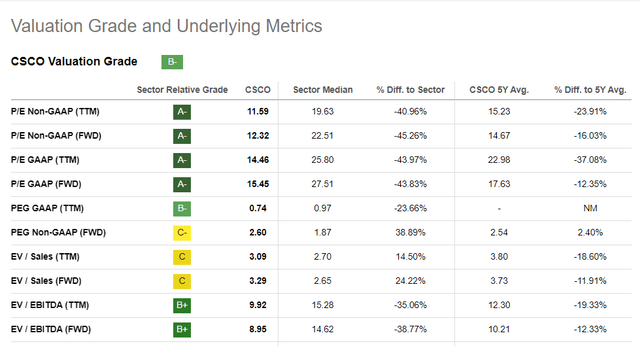
Next, IWD’s valuation problem is vividly illustrated by the fact that just ~19.2% of its holdings have a B- Quant Valuation grade or better; this is significantly lower even compared to July 2021, when the share was about 32%. Meanwhile, over 55% have a D+ rating or worse.
The weighting schema supports quality, but growth lags expectably
A few comments should be made on growth and quality exposures. As the index is not supposed to target growthier stocks (it does quite the contrary), both forward revenue and earnings per share growth rates are only modest, in the mid-single-digits.
Interestingly, the fund still holds a few notable sales growth stories, predominantly from the consumer discretionary sector, with the most remarkable listed below:
| Symbol | Weight | Sector | Revenue FWD |
| Rivian Automotive (RIVN) | 0.06% | Consumer Discretionary | 386.32% |
| Lucid Group (LCID) | 0.02% | Consumer Discretionary | 271.34% |
| Norwegian Cruise Line (NCLH) | 0.02% | Consumer Discretionary | 143.04% |
| Carnival Corporation & plc (CCL) | 0.08% | Consumer Discretionary | 133.24% |
| Royal Caribbean Cruises (RCL) | 0.09% | Consumer Discretionary | 117.45% |
Data from Seeking Alpha and the fund
IWD’s quality is also far from phenomenal, but there is not much to criticize harshly nonetheless. Since the Russell 1000 does not require profits to be delivered to become a constituent (unlike the S&P 500), about 7.2% of IWD’s holdings are loss-making companies. This also makes its 16% Return on Equity, together with exposure to debt-heavy firms, much less reliable. Regarding Return on Assets, I see a mostly acceptable but still obviously not ideal figure. However, the silver lining here is that 89% of the holdings have a B- Quant Profitability rating or stronger, which makes me conclude that quality characteristics are generally sound despite a few disappointments.
Mixed performance
Launched at the very beginning of the dot-com bubble burst, IWD was nevertheless a gross success story in the aughts as it outperformed the Russell 1000 ETF as well as the iShares Core S&P 500 ETF (IVV) from 2000 to 2006, most likely owing to its smaller exposure to growthier stocks that were decimated amid the market slump. So its comparatively strong annualized total return (on par with IVV and IWD) delivered during the June 2000-October 2023 period is principally the consequence of that.
| Portfolio | IVV | IWD | IWB |
| Initial Balance | $10,000 | $10,000 | $10,000 |
| Final Balance | $45,443 | $43,920 | $46,642 |
| CAGR | 6.68% | 6.52% | 6.80% |
| Stdev | 15.28% | 15.38% | 15.57% |
| Best Year | 32.30% | 32.09% | 32.78% |
| Worst Year | -37.02% | -36.47% | -37.40% |
| Max. Drawdown | -50.78% | -55.38% | -51.04% |
| Sharpe Ratio | 0.4 | 0.39 | 0.4 |
| Sortino Ratio | 0.57 | 0.55 | 0.57 |
| Market Correlation | 0.99 | 0.95 | 1 |
Data from Portfolio Visualizer
Interestingly, over that period, it captured significantly less upside than IWB, yet it was also not that vulnerable to bears as its downside capture ratio was also lower.
| Metric | IVV | IWD | IWB |
| Upside Capture Ratio (%) | 95.51 | 89.98 | 97.53 |
| Downside Capture Ratio (%) | 96.1 | 90.68 | 97.84 |
Data from Portfolio Visualizer
A ten-year period (November 2013-October 2023) was less successful for the strategy, as it not only materially underperformed both IVV and IWB but also had a steeper max drawdown and the highest standard deviation.
| Portfolio | IVV | IWD | IWB |
| Initial Balance | $10,000 | $10,000 | $10,000 |
| Final Balance | $28,712 | $20,423 | $27,706 |
| CAGR | 11.12% | 7.40% | 10.73% |
| Stdev | 14.94% | 15.16% | 15.15% |
| Best Year | 31.25% | 26.13% | 31.06% |
| Worst Year | -18.16% | -8.42% | -19.19% |
| Max. Drawdown | -23.93% | -26.73% | -24.57% |
| Sharpe Ratio | 0.7 | 0.47 | 0.67 |
| Sortino Ratio | 1.08 | 0.69 | 1.03 |
| Market Correlation | 1 | 0.95 | 1 |
Data from Portfolio Visualizer
Final thoughts
IWD offers exposure to a slightly better-valued portion of the Russell 1000, but it is certainly not a maximalist strategy. Owing to its underlying index’s methodological intricacies, it may have an overlap with the iShares Russell 1000 Growth ETF (IWF); at the moment, the overlap is approximately 26.7%, as per my calculations.
After dissecting the portfolio for the second time, I still do not see a factor mix attractive enough. At this juncture, IWD has a strong 5.6% earnings yield, but the problem is that it is unappealing from other angles.
I see a mix that would be neither perfectly fit for betting on the tech/growth rally to gain momentum, thus essentially expecting an interest rate cut sooner in 2024, nor suitable for expressing an opposite view and preparing for the higher-for-longer environment. There will be no rating upgrade, and IWB remains a Hold at best.
Credit: Source link