

















• bitcoinBitcoin(BTC)$77,484.000.16%
  • ethereumEthereum(ETH)$2,248.591.08%
  • tetherTether(USDT)$1.000.02%
  • binancecoinBNB(BNB)$705.881.18%
  • rippleXRP(XRP)$1.250.56%
  • usd-coinUSDC(USDC)$1.000.02%
  • solanaSolana(SOL)$95.801.61%
  • tronTRON(TRX)$0.312714-6.39%
  • Figure HelocFigure Heloc(FIGR_HELOC)$1.03-0.18%
  • zcashZcash(ZEC)$1,286.314.28%
  • HyperliquidHyperliquid(HYPE)$87.80-4.54%
  • dogecoinDogecoin(DOGE)$0.075559-0.02%
  • moneroMonero(XMR)$593.78-0.96%
  • USDSUSDS(USDS)$1.00-0.04%
  • chainlinkChainlink(LINK)$11.574.90%
  • whitebitWhiteBIT Coin(WBT)$74.370.34%
  • leo-tokenLEO Token(LEO)$9.37-0.27%
  • cardanoCardano(ADA)$0.1936510.90%
  • stellarStellar(XLM)$0.1716181.02%
  • nearNEAR Protocol(NEAR)$4.463.84%
  • bitcoin-cashBitcoin Cash(BCH)$287.84-1.71%
  • daiDai(DAI)$1.000.01%
  • Ethena USDeEthena USDe(USDE)$1.000.03%
  • uniswapUniswap(UNI)$7.051.74%
  • RainRain(RAIN)$0.006135-4.14%
  • litecoinLitecoin(LTC)$55.42-0.18%
  • CantonCanton(CC)$0.0974952.09%
  • USD1USD1(USD1)$1.000.03%
  • avalanche-2Avalanche(AVAX)$8.543.47%
  • suiSui(SUI)$0.902.15%
  • the-open-networkGram (prev. Toncoin)(GRAM)$1.215.64%
  • hedera-hashgraphHedera(HBAR)$0.0721041.42%
  • tether-goldTether Gold(XAUT)$3,873.33-0.54%
  • Global DollarGlobal Dollar(USDG)$1.000.00%
  • quant-networkQuant(QNT)$201.493.93%
  • paypal-usdPayPal USD(PYUSD)$1.00-0.02%
  • shiba-inuShiba Inu(SHIB)$0.0000050.00%
  • BittensorBittensor(TAO)$236.791.55%
  • crypto-com-chainCronos(CRO)$0.0518662.42%
  • EthenaEthena(ENA)$0.1939522.28%
  • Ripple USDRipple USD(RLUSD)$1.00-0.04%
  • Ondo US Dollar YieldOndo US Dollar Yield(USDY)$1.150.19%
  • Circle USYCCircle USYC(USYC)$1.140.00%
  • okbOKB(OKB)$110.73-0.53%
  • MemeCoreMemeCore(M)$0.92-4.31%
  • pepePepe(PEPE)$0.0000050.04%
  • aaveAave(AAVE)$135.438.41%
  • BlackRock USD Institutional Digital Liquidity FundBlackRock USD Institutional Digital Liquidity Fund(BUIDL)$1.000.00%
  • OndoOndo(ONDO)$0.4135143.99%
  • Pump.funPump.fun(PUMP)$0.0041702.11%
TradePoint.io
  • Main
  • AI & Technology
  • Stock Charts
  • Market & News
  • Business
  • Finance Tips
  • Trade Tube
  • Blog
  • Shop
No Result
View All Result
TradePoint.io
No Result
View All Result

SPHQ: Solid Long-Term ETF, Hugs The S&P 500 Closely (NYSEARCA:SPHQ)

November 27, 2023
in Market & News
Reading Time: 5 mins read
A A
SPHQ: Solid Long-Term ETF, Hugs The S&P 500 Closely (NYSEARCA:SPHQ)
ShareShareShareShareShare

shih-wei

YOU MAY ALSO LIKE

Top Story with Tom Llamas – Oct. 05 | NBC News NOW

Caleb Flynn sentenced to life without parole

High-quality S&P 500 stocks have outperformed the broad US large-cap index over the past three years. On a total return basis, the Invesco S&P 500 Quality ETF (NYSEARCA:SPHQ) is just fractionally below its all-time weekly closing high, illustrated in the chart below. While SPHQ has given back some relative gains in the last month, considering the rebound led by riskier stocks as interest rates have turned lower, SPHQ has a solid track record.

I have a hold rating on the fund. While it doesn’t differ much from the SPX itself, a focus on several measures of quality can offer some benefit during periods of market turmoil, but its portfolio is not all that cheap today.

SPHQ: Small Alpha Produced Last 3 Years

SPHQ: Small Alpha Produced Last 3 Years

Stockcharts.com
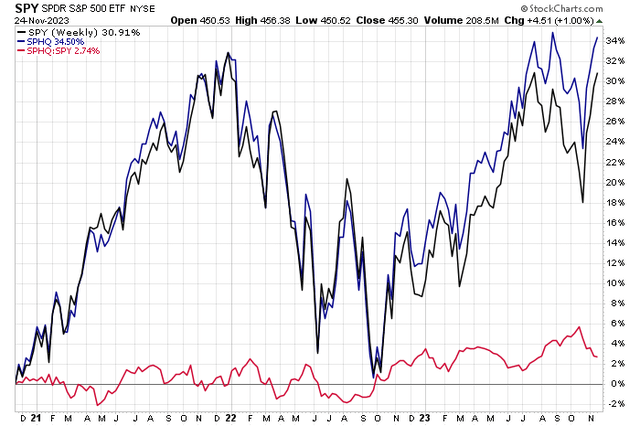
For background, SPHQ aims to track an index of stocks in the S&P 500 that have the highest quality score, which is calculated based on three fundamental measures: return on equity, accruals ratio, and financial leverage ratio. The fund and the index are rebalanced and reconstituted semi-annually on the third Friday of June and December, according to Invesco.

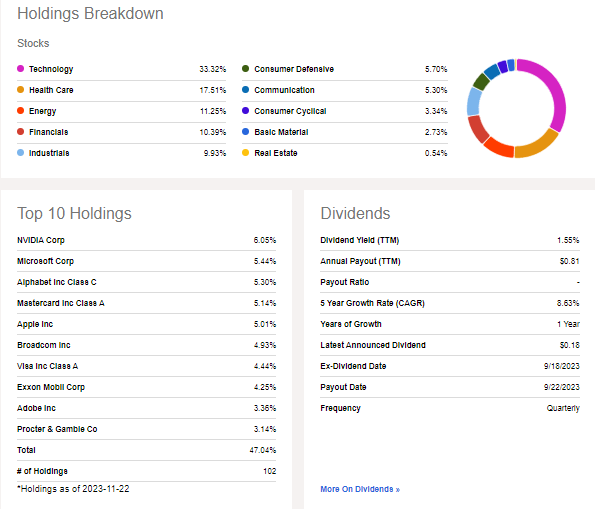
SPHQ is a large ETF with more than $6.5 billion in assets under management, and its trailing 12-month dividend yield is about on par with the S&P 500’s at 1.55%. The ETF sports an “A” ETF Grade from Seeking Alpha for its strong share-price momentum characteristics, while a low 0.15% annual expense ratio earns SPHQ a solid A- rating. The fund is not overly risky given its large-cap and quality construction methods and the ETF’s liquidity measures are robust considering the average daily volume of slightly more than one million shares and a 30-day median bid/ask spread of just two basis points as of November 24, 2023.

Digging into the portfolio, SPHQ is almost entirely a large-cap fund with just 13% of assets considered mid-cap by Morningstar. The 5-star, Silver-rated fund by that research firm shows a moderate 17.2 price-to-earnings ratio, though it is expensive on a price-to-book basis. It also trades more than 12 times cash flow, which is also somewhat pricey. Long-term earnings growth is quite strong, however.

SPHQ: Portfolio & Factor Profiles

SPHQ: Portfolio & Factor Profiles

Morningstar
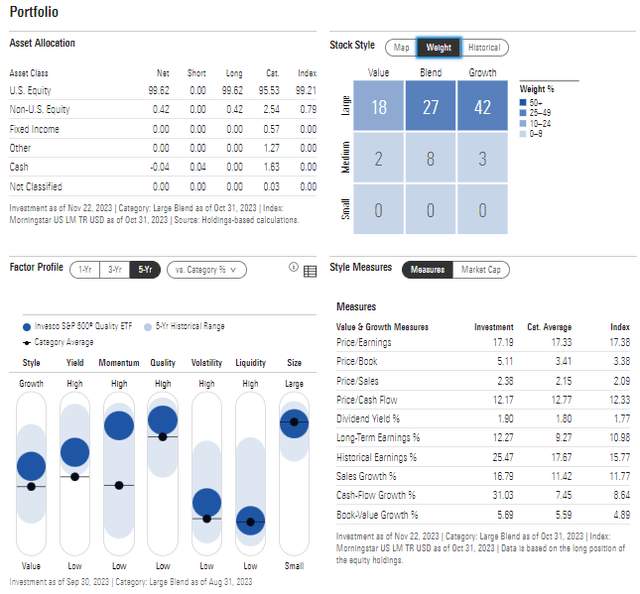
The portfolio breakdown reveals that the fund closely resembles the S&P 500, making me not overly excited to stray from the index by going overweight this ETF. Tech is fully a third of SPHQ but notice the top holding – it isn’t Apple (AAPL) or Microsoft (MSFT), but rather NVIDIA (NVDA). In general, however, the allocation looks similar to the SPX. There is a bit of an added risk in that almost half the fund is invested in the top 10 stocks.

SPHQ: Holdings & Dividend Information

SPHQ: Holdings & Dividend Information

Seeking Alpha
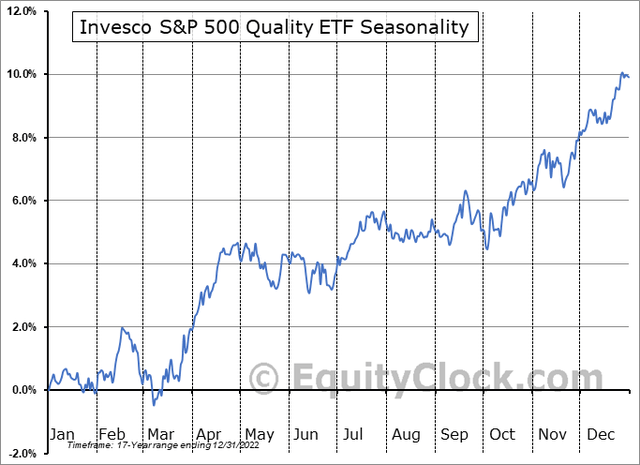
Seasonally, SPHQ tends to rally into year-end, but then sputter over the first handful of weeks of the new year, according to data from Equity Clock. Still, December has been positive 82% of the time over the past 17 years, per the data’s history, and the typical return in the final month of the year is 1.4% with a 0.0% average gain in January.

SPHQ Seasonality: Bullish Trends Into Year-End

SPHQ Seasonality: Bullish Trends Into Year-End

Equity Clock
The Technical Take

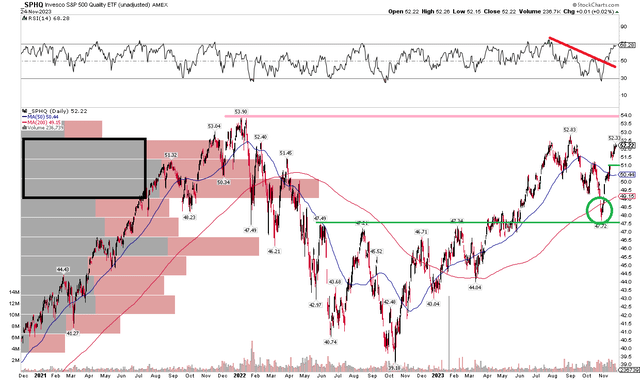
With an allocation and performance that both look close to the S&P 500, the technical chart is likewise comparable. Notice in the chart below that shares are encroaching on all-time highs – a modest outperformance versus domestic large caps. I think new highs are in play over the coming months now that the long-term 200-day moving average is positively sloped.

Also, take a look at the RSI momentum oscillator at the top of the graph – it broke a downtrend line a few weeks ago, confirming the snapback in price. A climb above the August peak of $52.83 would likely help bring about all-time highs before the end of the year amid positive seasonal trends right now. On the downside, be mindful of a gap near $51 – that could get filled if we see troubling macro data soon, but I see long-term support at $47.50 which held perfectly during the August to October correction.

Overall, the technical situation is generally solid, much like that of the S&P 500 today.

SPHQ: RSI Breakout Confirms the Price Rebound, All-Time Highs In Play

SPHQ: RSI Breakout Confirms the Price Rebound, All-Time Highs In Play

Stockcharts.com
The Bottom Line

I have a hold rating on SPHQ. Its very close resemblance to the S&P 500 is somewhat unappealing if you are looking to sharply beat the market over time, but with modest alpha produced over the past few years, it’s also not a bad choice if you want to modestly tweak your US large-cap weighting style.

Credit: Source link

ShareTweetSendSharePin

Related Posts

Top Story with Tom Llamas – Oct. 05 | NBC News NOW
Market & News

Top Story with Tom Llamas – Oct. 05 | NBC News NOW

October 31, 2026
Caleb Flynn sentenced to life without parole
Market & News

Caleb Flynn sentenced to life without parole

October 31, 2026
NBC Nightly News with Tom Llamas Full Episode – Oct. 5
Market & News

NBC Nightly News with Tom Llamas Full Episode – Oct. 5

October 31, 2026
Arizona college student charged after viral police arrest
Market & News

Arizona college student charged after viral police arrest

October 31, 2026
Next Post
GameStop clerk expresses remorse in fatal shooting of man suspected of shoplifting

GameStop clerk expresses remorse in fatal shooting of man suspected of shoplifting

Leave a Reply Cancel reply

Your email address will not be published. Required fields are marked *

Search

No Result
View All Result
Special Report: Hurricane Isaias downgraded to category two as it’s expected to make landfall

Special Report: Hurricane Isaias downgraded to category two as it’s expected to make landfall

October 28, 2026
Feds seize Rep. Omar’s phone in immigration status probe

Feds seize Rep. Omar’s phone in immigration status probe

October 25, 2026
Special report: Vatican says Pope Leo diagnosed with lung cancer after surgery

Special report: Vatican says Pope Leo diagnosed with lung cancer after surgery

October 26, 2026

About

Learn more

Our Services

Legal

Privacy Policy

Terms of Use

Bloggers

Learn more

Article Links

Contact

Advertise

Ask us anything

©2020- TradePoint.io - All rights reserved!

Tradepoint.io, being just a publishing and technology platform, is not a registered broker-dealer or investment adviser. So we do not provide investment advice. Rather, brokerage services are provided to clients of Tradepoint.io by independent SEC-registered broker-dealers and members of FINRA/SIPC. Every form of investing carries some risk and past performance is not a guarantee of future results. “Tradepoint.io“, “Instant Investing” and “My Trading Tools” are registered trademarks of Apperbuild, LLC.

This website is operated by Apperbuild, LLC. We have no link to any brokerage firm and we do not provide investment advice. Every information and resource we provide is solely for the education of our readers. © 2020 Apperbuild, LLC. All rights reserved.

No Result
View All Result
  • Main
  • AI & Technology
  • Stock Charts
  • Market & News
  • Business
  • Finance Tips
  • Trade Tube
  • Blog
  • Shop

© 2023 - TradePoint.io - All Rights Reserved!