

Lock Stock
I found that Block, Inc. (NYSE:SQ) has a good technical set-up for the stock which is supported by a positive earnings report, higher guidance, an attractive valuation, and strong expected long-term growth.
The positive Q3 2023 results are a likely catalyst for the stock to run higher at least until the next earnings report or major catalyst. This catalyst appears to have anchored the stock in a bottom and recovery formation. This can place the stock on an upward journey to make up a lot ground that was lost over the past two years.
Q3 Earnings Report as a Catalyst
Block achieved net revenue growth of $5.62 billion over consensus estimates of $5.43 billion. This was 3.5% higher than estimates and 24% higher than Q3 2022. Block also achieved EPS of $0.55 for Q3 2023 over analysts’ estimates of $0.46. That’s 19.6% higher than estimates and 30.1% higher than EPS of $0.42 from Q3 2022.
Transaction-based revenue increased 9% over Q3 2022 to $1.66 billion. However, Block did fall a little short of Visible Alpha’s estimates of $61.1 billion for gross payment volume and ended up with $60.1 billion for Q3. On the bright side, gross payment volume was still 10.5% higher than Q3 2022.
Adjusted EBITDA for Q3 came in at $477 million which was 46% higher than Q3 2022. This marked a record high for quarterly EBITDA for the company. Block reiterated its guidance for adjusted EBITDA to be $1.5 billion which is a bit lower than Visible Alpha’s estimate of $1.52 billion. The company also gave guidance for 2024 adjusted EBITDA to be $2.4 billion which is higher than Visible Alpha’s estimate of $1.94 billion. The $2.4 billion in adjusted EBITDA would be about 40% higher than Block’s guidance of $1.66 billion for 2023. So, significant growth is expected for 2024.
These achievements were largely the result of strong performance for Square and Cash App during Q3. Square’s gross profit increased 15% to $899 million while Cash App’s gross profit increased by an impressive 27% to $984 million.
These positive results and guidance can act as a catalyst to drive the stock higher over the next few months or until the next catalyst arrives. The next catalyst would likely be the next earnings report on February 22, 2024 unless Block has other significant developments between now and then.
Strong Technical Set-up
Block Inc. (SQ) Daily Stock Chart w/ MACD & RSI (tradingview.com)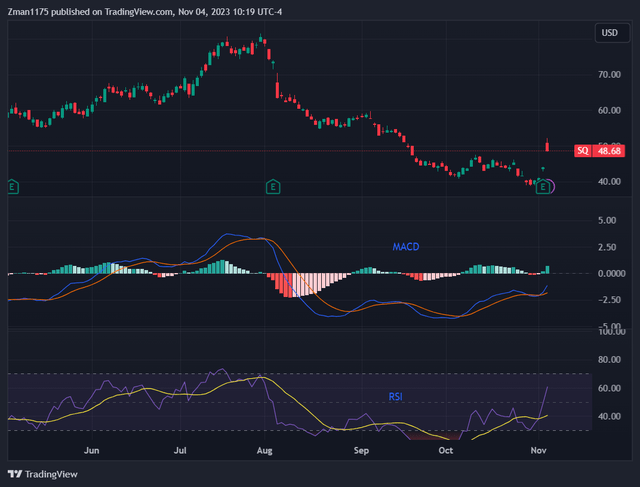
The daily stock chart above shows a bullish divergence between the price of the stock and the MACD & RSI indicators. The price made a recent drop from low to low, while the MACD and RSI indicators increased over the same period. This may result in a change in trend from negative to positive for the stock.
The MACD indicator (middle of chart) recently rose above the red signal line as the histogram shifted from red bars to green bars. The purple RSI line (bottom of chart) recently moved above the yellow moving average line and above 50. These both show a change in trend back to positive. This demonstrates new positive momentum for the stock which may continue given the positive recent earnings report.
Block Inc. (SQ) Weekly Stock Chart w/ MACD & RSI (tradingview.com)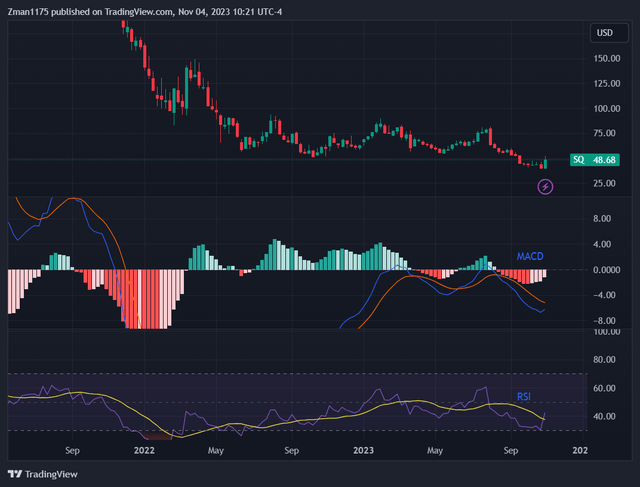
The weekly chart above shows the strong recent green candle as a result of the positive earnings report. The blue MACD indicator in the middle of the chart looks like it is about to cross above the red signal line as the histogram turned from red to pink. The purple RSI at the bottom of the chart just crossed above the yellow moving average from an oversold condition. This looks positive for the stock. If the blue MACD line crossed above the red signal line and the histogram’s bars turn green, this would indicate a longer-term change in trend back to positive.
Block Inc. (SQ) Monthly Stock Chart w/ MACD & RSI (tradingview.com)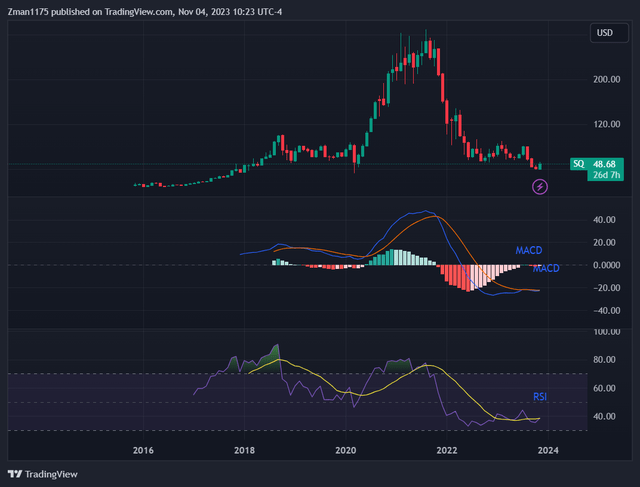
I zoomed out to the monthly chart above where each candle represents an entire month. The important point that I wanted to make regarding the monthly chart is that it looks like the stock could be bottoming at a multiple-year support level. There is support between the $30 and $50 range over the past 5 years.
The MACD and RSI are showing a bullish divergence as compared to the stock price from 2022 to present. The MACD & RSI have a slight uptrend during this time period, while the stock decreased. This shows that the momentum could change back to a positive new uptrend.
Some may say that the stock is forming a head and shoulders pattern which is typically bearish. However, even if this were true, the next resistance is in the $80 to $90 range and the left shoulder sits at $100. So, there could be a strong rally even under a longer-term bearish head and shoulders set-up.
Of course, Block’s fundamental performance should determine the next moves for the stock over this long-term period. If the company continues to perform well in the form of revenue/earnings growth, then the stock is likely to move higher over time and refute the bearish thesis.
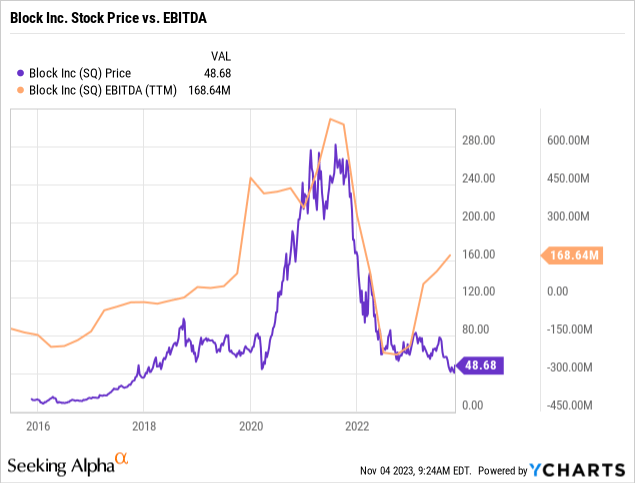
The chart above compares Block’s stock price and EBITDA growth. The stock tends to correlate well with EBITDA growth. Recently, the EBITDA growth pulled away from the stock price, creating a large gap. This implies that the stock price has some catching up to do. The stock made a significant move higher during the 2016 to 2021 period when a gap existing between EBITDA and the stock price. So, a similar set-up could lead to another strong run higher for the stock if EBITDA continues to grow.
Low Valuation
There are other aspects to the stock that can help drive the bullish thesis. One key factor is the stock’s low valuation. I’m using the PEG ratio for Block because the company is expected to have average annual earnings growth of about 34% over the next 3 to 5 years. This is significantly higher than the sector median of 9%. Block is trading with a low PEG ratio of just 0.61 (below the sector median of 1.21). It is also significantly lower than the Software Infrastructure industry’s PEG of 2.3.
The growth stocks that I cover tend to perform well when the PEG is between one and two. So, when I see a stock with a PEG below one, it looks even more intriguing as an investment from a valuation perspective. The stock’s new found momentum from the recent Q3 earnings report & positive guidance gives it plenty of room to move higher from this low valuation.
Block’s strong expected revenue and earnings growth is likely to drive the stock for above-average gains in 2024. Block stated in the Q3 2023 earnings conference call that it expects 2024 to be its “strongest year of profitability yet.” Block expects to achieve this through margin expansion by driving operational efficiencies and minimizing expenses.
Block’s Long-Term Outlook
Block’s stock is poised to perform well over the next year from the bullish technical set-up which is supported by strong above-average revenue/EBITDA growth from an attractive low valuation. The company is expecting 2024 to be its most profitable yet as efforts move towards increasing margins.
If Block’s expectations of about 40% EBITDA growth for 2024 are achieved, then the stock is likely to outperform the broader market over the next year. Of course, the main risk for the company and the stock is a potential economic slowdown which could reduce demand for Square and Cash App transactions. Also, a market correction would likely drag Block’s stock down along with the broader market.
Analysts have a one-year price target of $75 for the stock which is 54% higher than the current price. The target is supported by the technical perspective as $75 is near the next level of resistance for the stock. The target is also supported by expectations of strong revenue EBITDA growth from a low valuation.
Credit: Source link




/cloudfront-us-east-2.images.arcpublishing.com/reuters/YRLS2I4MQRL5HGI7CSK7JJXRNQ.jpg "Russia’s new nuclear submarine test launches Bulava intercontinental missile")