


































JHVEPhoto
Thesis
In light of the comprehensive analysis conducted, it is evident that The Walt Disney Company’s (NYSE:DIS) short-term stock performance presents a cautious outlook. While there is potential for positive surprises in streaming revenues and room for growth in the theme park segment through price adjustments, the prevailing risks appear to outweigh the anticipated rewards. Consequently, this analysis suggests a “sell” rating for Disney, accompanied by a recommended target price of $70.7, indicating a 12.4% downside from the current stock price of $80.7. As investors navigate the ever-evolving dynamics of the media and entertainment industry, it is imperative to remain vigilant, recognizing the complex competitive landscape and the array of challenges that Disney may face in the years ahead.
Overview
As depicted in the chart below from Statista, Disney operates in five distinct segments, each contributing to its overall revenue. The first is Media & Entertainment, accounting for 38.23% of Disney’s total revenue. Following this is the Parks segment, responsible for 22.73% of the company’s income, and Linear Networks, representing 18.20%. Next is Direct-to-Consumer, contributing 15.08%, and finally, Content Sales, which constitutes 5.6% of the revenue.
Statista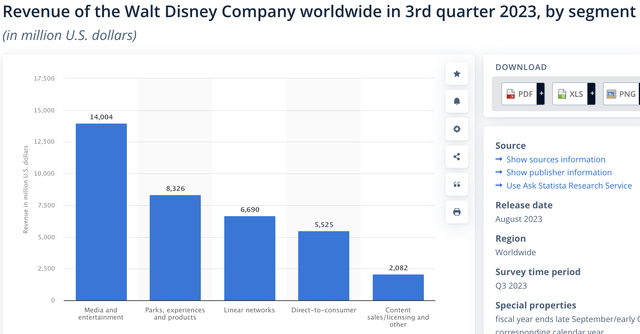
Linear Networks
This segment is responsible for Disney’s pay-TV channels, including Disney Channel, ESPN, National Geographic, and more. It poses a significant risk to Disney’s prospects due to the ongoing decline in the pay-TV market, a trend not expected to change in the near future.
Furthermore, Linear Networks accounts for approximately 18.20% of Disney’s revenue, a considerable amount despite the challenges it faces.
statista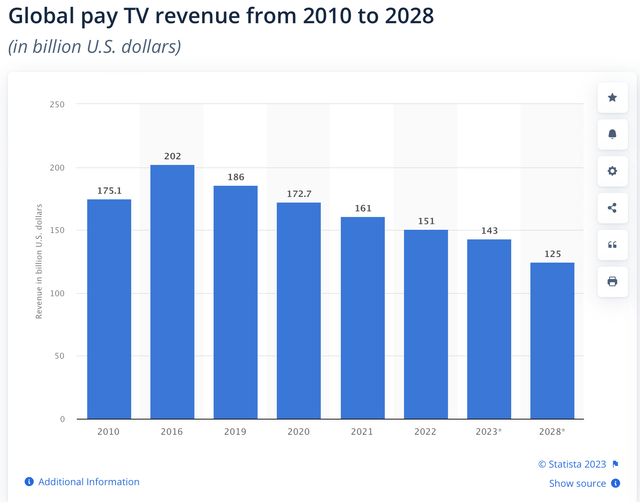
Direct to Consumer
In my opinion, this segment holds the most promising potential for predictable growth. This division oversees Disney’s various streaming services, such as Disney+, ESPN+, Hulu, and Star+. Notably, the global streaming market is projected to experience a robust CAGR of 12.66% from 2023 to 2027.
Worldwide streaming market revenue forecasts (Statista)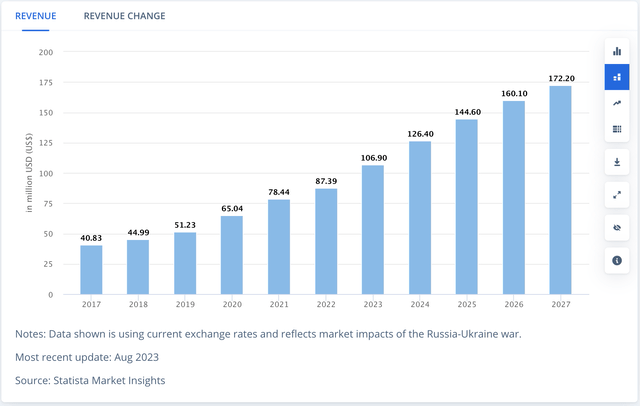
Content Sales
This segment requires minimal description. Disney sells its content to third parties, but an interesting development is that Disney may see an increase in revenues in this segment. As mentioned in my article about Netflix, Inc. (NFLX), Disney is beginning to license content that was previously exclusive to Disney+ to other third parties. However, this move could pose a competitive risk for Disney, as Disney+’s main advantage was its exclusive access to Star Wars and Marvel content. Now, it might make more sense for consumers to subscribe to Netflix, as they haven’t indicated any plans to license their content in the near future.
Various growth projections exist for this market. One article on LinkedIn suggests a 5.82% growth rate, while the lowest estimate I found was from Business Research Insights, suggesting 4.34%.
Disney Parks
The final segment I will discuss is Disney Parks, which requires little explanation. This segment encompasses Disney’s world-renowned theme parks.
For the worldwide theme park market, there are differing growth estimates. For instance, one article on LinkedIn suggests a 3.5% growth rate, while Global Newswire suggests 7.18%, averaging out to 5.34%.
Financials
Disney experienced a significant revenue surge during the pandemic when people turned to online entertainment services to keep themselves entertained as they couldn’t visit restaurants, cinemas, or other traditional entertainment venues that required leaving their homes.
As illustrated in the graph below, Disney achieved a 4.36% revenue growth from 2017 to 2021. However, in the period of 2021-2022, revenue soared by approximately 22%, and from 2022-2023, revenue increased by around 6.1%. This indicates that the revenue growth returned to pre-pandemic levels.
Author’s Calculations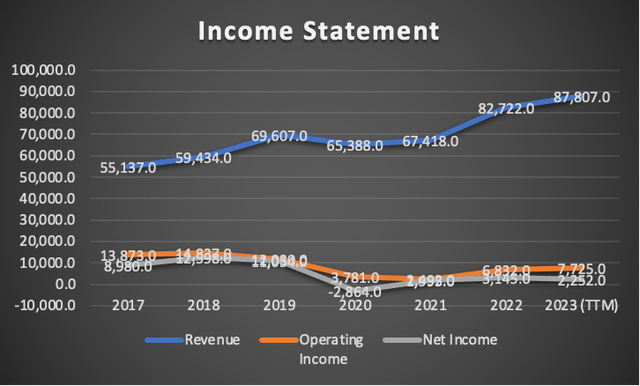
Disney’s profit margins have markedly deteriorated. As shown in the table below, both net income margin and operating margin exceeded the 20% mark in 2018. However, they now stand at 2.56% and 8.8%, respectively.
Author’s Calculations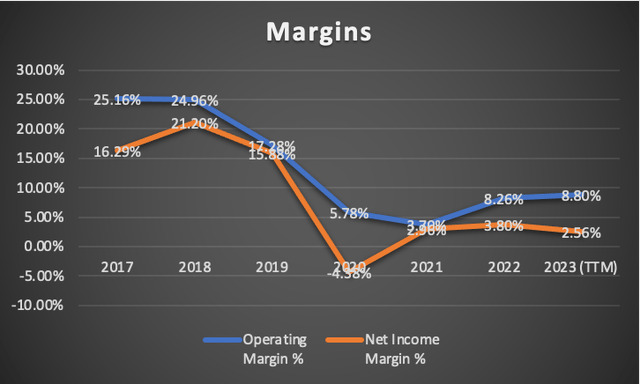
On the brighter side, Disney’s balance sheet shows improvement compared to the earlier discussed aspects. Since 2020, Disney has been reducing its long-term debt, as well as its short-term debt. However, when examining their cash reserves, the optimism diminishes. From 2020 to 2023, Disney’s cash balance decreased by approximately $6.5 billion.
Author’s Calculations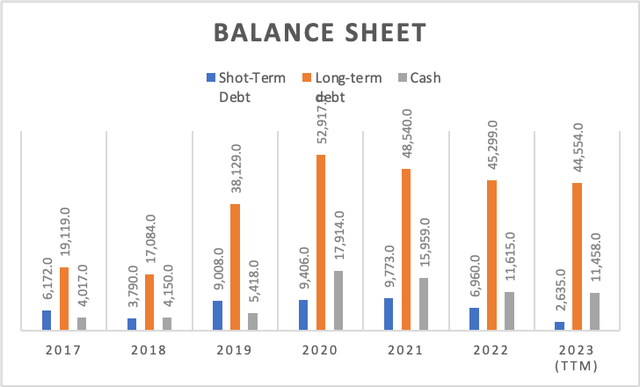
Another concerning aspect is Disney’s free cash flow, currently standing at around 4.1%, equating to approximately $3.5 billion in annual free cash flow. This is insufficient for substantial mergers and acquisitions or extensive company investments. As depicted in the table “FCF Components,” this reduction in free cash flow generation is attributed to decreased cash flows from operations, requiring more complex solutions.
Author’s Calculations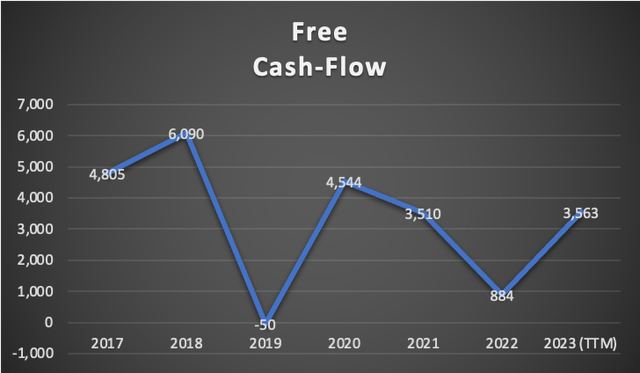
Author’s Calculations Author’s Calculations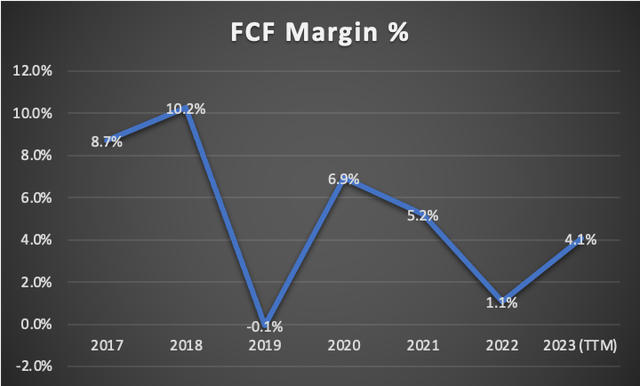
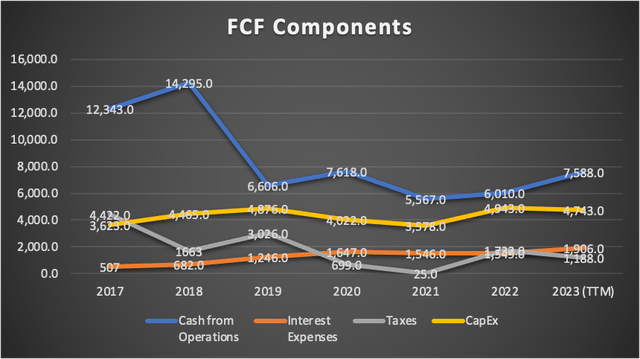
Overall, Disney’s financial position is not particularly strong, which may explain their urgency to generate cash, including content sales and spin-offs.
Valuation
In this valuation section, I will present two models. The first model will consider analysts’ estimates available on Seeking Alpha, while the second will be a model I’ve developed from scratch to assess whether Disney may have a larger upside or downside compared to analysts’ expectations.
The variables required for calculating the WACC will be extracted from the chart below, which contains all the current data available for Disney. Additionally, I will calculate Depreciation & Amortization (D&A) and interest expenses with margins tied to revenue.
For the sake of optimism in assessing the downside, CapEx will remain constant across the years in this projection.
| TABLE OF ASSUMPTIONS | |
| (Current data) | |
| Assumptions Part 1 | |
| Equity Value | 110,942.00 |
| Debt Value | 47,189.00 |
| Cost of Debt | 4.04% |
| Tax Rate | 34.53% |
| 10-yr Treasury | 4.80% |
| Beta | 1.04 |
| Market Return | 10.50% |
| Cost of Equity | 10.73% |
| Assumptions Part 2 | |
| EBIT | |
| Tax | 1,188.00 |
| D&A | 5,277.00 |
| CapEx | 4,743.00 |
| CapEx Margin | 5.40% |
| Assumption Part 3 | |
| Net Income | 2,252.00 |
| Interest | 1,906.00 |
| Tax | 1,188.00 |
| D&A | 5,277.00 |
| Ebitda | 10,623.00 |
| D&A Margin | 6.01% |
| Interest Expense Margin | 2.17% |
| Revenue | 87,807.0 |
Analysts’ Estimates
In the first valuation model, I will determine Disney’s fair value assuming a revenue growth rate of 11.58% and a net income growth rate of 20.50% as expected by analysts. I will also explore the scenario where CapEx remains steady at the current level of $4.8 billion, which would positively impact Disney’s valuation.
| Revenue | Net Income | Plus Taxes | Plus D&A | Plus Interest | |
| 2023 | $89,040.0 | $2,735.28 | $3,679.90 | $9,031.01 | $10,963.77 |
| 2024 | $93,670.0 | $3,322.27 | $4,469.61 | $9,820.71 | $11,753.48 |
| 2025 | $104,554.5 | $4,035.23 | $5,428.79 | $11,712.27 | $13,981.81 |
| 2026 | $116,703.7 | $4,901.19 | $6,593.81 | $13,607.43 | $16,140.69 |
| 2027 | $130,264.6 | $5,952.98 | $8,008.84 | $15,837.45 | $18,665.06 |
| 2028 | $145,401.4 | $7,230.50 | $9,727.54 | $18,465.83 | $21,622.01 |
| ^Final EBITA^ |
Author’s Calculations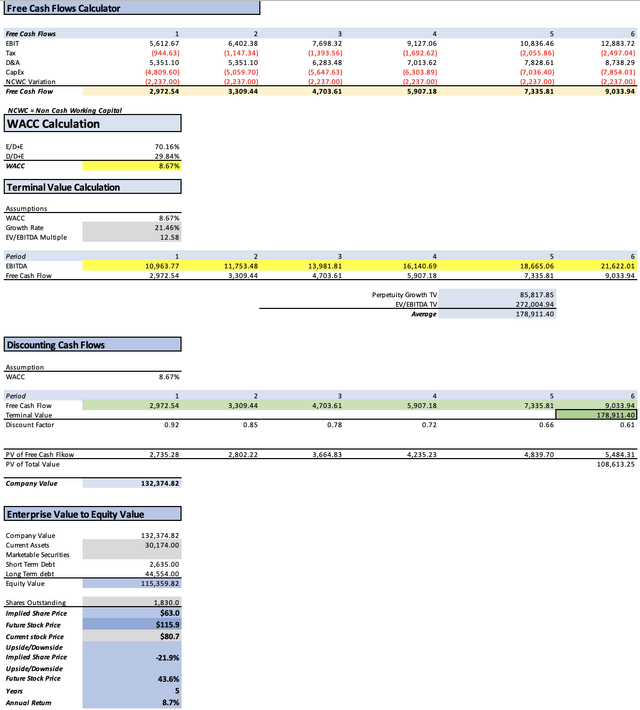
This initial model suggests a fair price of $63, indicating a 21.9% downside from the current stock price of $80.7. The projected future stock price of $115.9 implies an annual return of approximately 8.7%. However, it’s worth noting that Disney’s CapEx has historically not surpassed the $5 billion mark, suggesting that it may remain stable around the current $4.8 billion level.
Author’s Calculations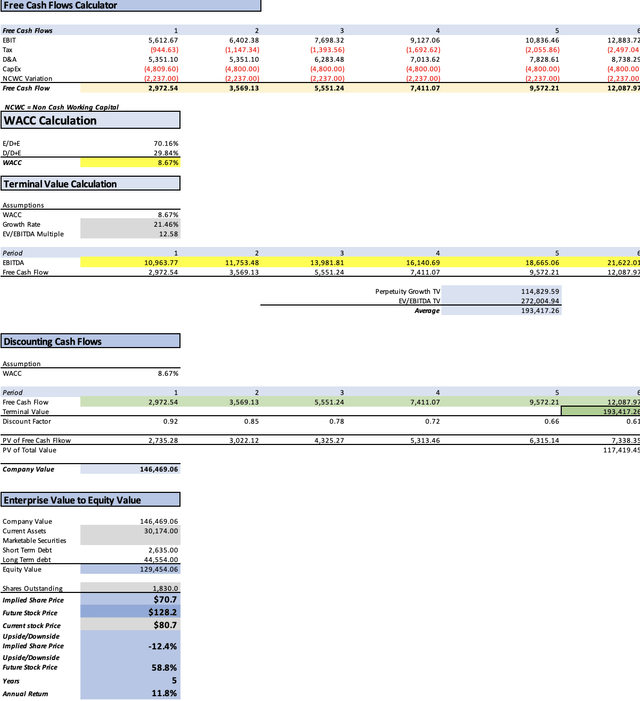
As you can see, this second model suggests a fair price of $70.7, which represents a 12.4% downside from the current stock price of $80.7. Then the future stock price of $128.2 suggests annual returns of around 11.8%.
My estimates
In the final model, I will attempt to determine Disney’s present fair value from the expected market projections for each of Disney’s operating segments.
In this initial step, I will project each of Disney’s segments based on the anticipated market growth rates discussed in the “Overview” section. Additionally, you will find the breakdown of Disney’s total revenue by segment, based on the latest Q3 2023 earnings report, as shown in the first chart in the “Overview” section.
| Media & Entertaiment | Parks | Linear Networks | Direct to Consumer | Licensing | |
| 2023 | 34,040.0 | 20,238.8 | 16,205.3 | 13,427.2 | 4,986.2 |
| 2024 | 36,048.4 | 21,291.2 | 15,647.8 | 15,127.1 | 5,280.9 |
| 2025 | 38,175.2 | 22,398.4 | 15,109.5 | 17,042.2 | 5,593.0 |
| 2026 | 40,427.5 | 23,563.1 | 14,589.8 | 19,199.8 | 5,923.6 |
| 2027 | 42,812.8 | 24,788.3 | 14,087.9 | 21,630.4 | 6,273.7 |
| 2028 | 45,338.7 | 26,077.3 | 13,603.3 | 24,368.9 | 6,644.4 |
| % of Revenue | 38.23% | 22.73% | 18.20% | 15.08% | 5.60% |
| Revenue | Net Income | Plus Taxes | Plus D&A | Plus Interest | |
| 2023 | $88,897.5 | $2,730.90 | $3,674.02 | $9,016.56 | $10,946.23 |
| 2024 | $93,395.4 | $3,312.53 | $4,456.51 | $9,799.05 | $11,728.72 |
| 2025 | $98,318.3 | $3,794.55 | $5,104.99 | $11,013.70 | $13,147.87 |
| 2026 | $103,703.7 | $4,355.23 | $5,859.31 | $12,091.66 | $14,342.73 |
| 2027 | $109,593.1 | $5,008.31 | $6,737.93 | $13,324.22 | $15,703.13 |
| 2028 | $116,032.6 | $5,770.05 | $7,762.73 | $14,736.02 | $17,254.71 |
| ^Final EBITA^ |
Author’s Calculations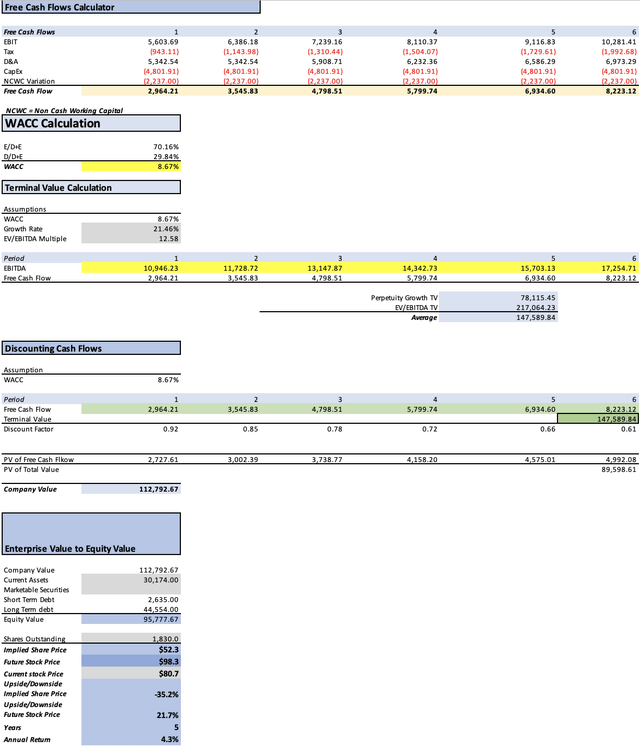
This model suggests a fair price of $52.1, signifying a 35.2% downside from the current stock price of $80.7. The projected future stock price of $98.3 implies an annual return of approximately 4.3%.
So What?
As evident from each model, Disney does not offer very promising stock returns in the short term. The significant downsides and low annual returns lead me to believe that Disney may not be worth the associated risks.
Moreover, as I mentioned earlier, Disney’s decision to once again license its content could expose it to increased competition in the streaming market. Additionally, Disney maintains an 18% exposure to the pay-TV market, which is currently in decline.
I would rate Disney as a “sell,” and since I consider my own estimates too pessimistic, I will recommend a target price of $70.7 (analysts’ estimates). This target reflects a 12.4% downside from the current stock price of $80.7.
Risks To Thesis
The primary risk to this bearish thesis lies in the potential for Disney to pleasantly surprise us with better-than-expected revenues from its streaming business, a segment I believe has promising growth prospects.
The second risk relates to the acceleration of theme park revenue, Disney’s second-largest segment. Here, Disney could gain a significant advantage if they choose to raise prices, given the evident popularity of their theme parks. Even a modest ticket price increase of just $20 could result in an additional revenue of over $300 million, considering only Disney’s Magic Kingdom park.
Statista Disney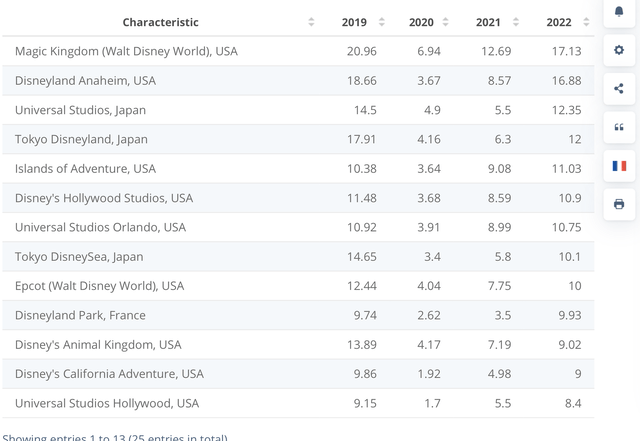

However, it’s crucial to recognize that Disney cannot merely rely on price increases to achieve 20% annual returns or a 40% near-term upside. In essence, at best, Disney might be able to offset its near-term downside, bringing it to zero, and the stock would likely hover around its current price point.
Conclusion
In conclusion, the outlook for Disney, as I’ve analyzed, doesn’t appear to be particularly rosy in the near term. Despite the potential for positive surprises in streaming revenues and the opportunity for growth in their theme park segment through price adjustments, the overall risk seems high, and the returns remain notably low. As of my analysis, I would rate Disney as a “sell” and recommend a target price of $70.7, reflecting a 12.4% downside from the current stock price of $80.7. While my own estimates may lean slightly on the cautious side, it’s prudent to consider the broader financial landscape and the competitive dynamics at play in the markets Disney operates in. Disney may face challenges and uncertainties that require close scrutiny by investors as they navigate the evolving media and entertainment landscape.
Credit: Source link