

SeanShot
SS&C Technologies Holdings, Inc. (NASDAQ:SSNC) reported its latest quarterly results with earnings falling just short of estimates. The company recognized for its leading financial services administration software has struggled to recapture the growth momentum during the pandemic.
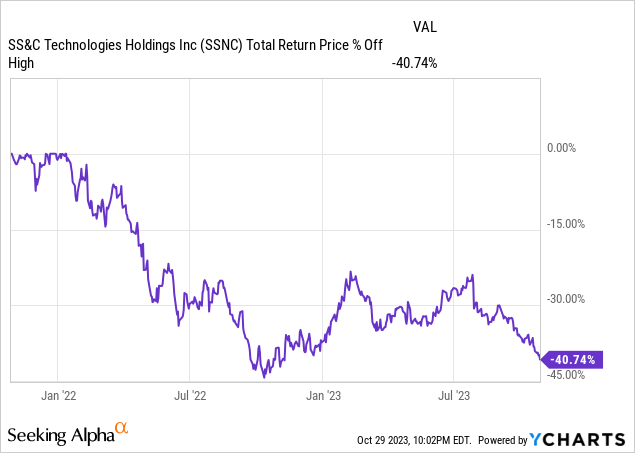
Indeed, SSNC is down more than 40% from its all-time high and even trading 20% lower over the last few months. On the other hand, we can point to several trends and encouraging developments suggesting some underlying strength in a positive long-term outlook. There is even a case to be made that shares are undervalued.
The setup here is that the company remains exposed to operating and financial trends within the broader investment management and private equity industries. That’s a problem because sentiment has been particularly poor against several macro headwinds. We see room for shares to rebound but expect volatility to continue over the near term.
SSNC Q3 Earnings Recap
SSNC reported Q3 adjusted EPS of $1.17, up 1.7% year over year although $0.01 below the consensus. Adjusted revenue in the quarter of $1.4 billion climbed by 3.4% from Q2 2022.
The context here is that even with the uptick in earnings this quarter, EPS over the first nine months of the year is still down by -4.3% over the period in 2022 and also lower than the record 2021. Nevertheless, there are some strong points with an improvement compared to the start of the year.
Q3 adjusted EBITDA reached $534 million, up 6.4% y/y at a margin of 39.1% compared to 38.0% last year. Management explains the improvement here reflects some effort at disciplined expense management despite dealing with higher personnel costs as a continuation of the inflationary pressures this cycle.
source: company IR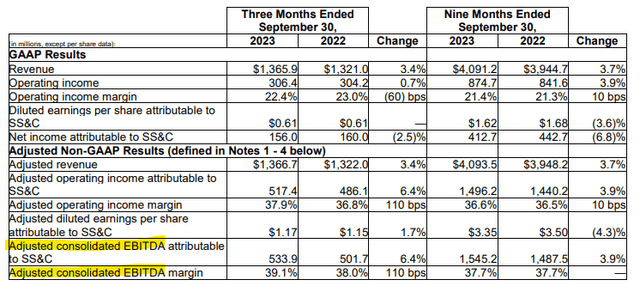
Operationally the results are mixed across the various business lines. A major theme has been “tough comps” considering some large contracts and the timing of revenue recognition going back to 2022 impact the growth rate.
That’s the case with the company’s flagship “Advent” platform as well as on the institutional and investment management (I&IM)) capabilities where adjusted organic growth was down by -31.1%. There is a sense that this side of the business has been pressured by broader market conditions including more intense competition compared to other segments where SS&C has a stronger industry advantage.
Favorably, the company’s solutions for “alternatives” which represent nearly a quarter of total revenues continue to drive growth at an 8.4% rate in Q3 with SS&C citing “private markets” up over 20% y/y this quarter. We can also note that overall revenue retention at 97.3% has climbed sequentially over the last three quarters and is the highest in the company’s history.
source: company IR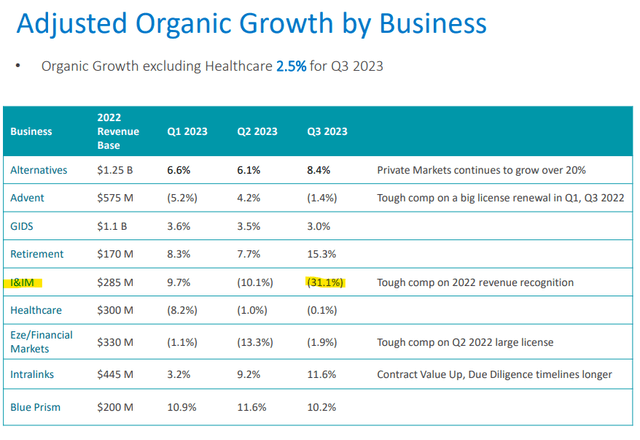
Management is guiding for full-year adjusted revenue growth between $5.464 and $5.504 billion with a 2.5% y/y midpoint growth rate. The target for adjusted EPS from $4.55 and $4.64 compares to $4.65 in 2022 and $5.02 in 2021 which gives some context to the stock price performance over the period.
The understanding is that while top-line growth remains steady, the shifting sales mix across business lines and continued R&D requirements have limited the gains in profitability.
source: company IR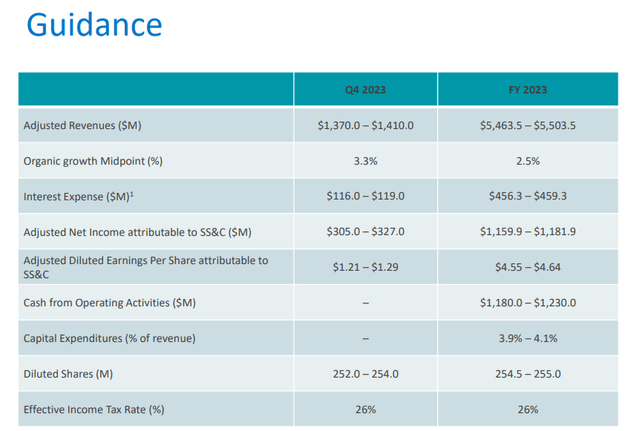
Finally, the other major theme for the company has been an effort at ongoing deleveraging. Supported by higher cash flows, SSNC has paid down debt taking the net leverage ratio to 3.2x compared to 3.5x in the period last year.
At the same time, the company has also been active with share buybacks lowering the outstanding share count by 2.5% year to date. Notably, management has made comments suggesting their belief that the stock price is fundamentally undervalued with an expectation for further buybacks going forward. From the latest earnings conference call:
SS&C paid down $54.7 million in debt in Q3 2023, bringing our net leverage ratio to 3.18 times consolidated EBITDA, attributable to SS&C. In the near term, we believe SS&C’s common stock is undervalued, and we expect to maintain a higher level of stock repurchases versus debt paydown.
This is in addition to the regular dividend which was just hiked by 20% to a new quarterly rate of $0.24 per share. The forward yield on the stock is approximately 2.0%. The earnings payout ratio under 25% is at a sustainable and even conservative level in our opinion.
source: company IR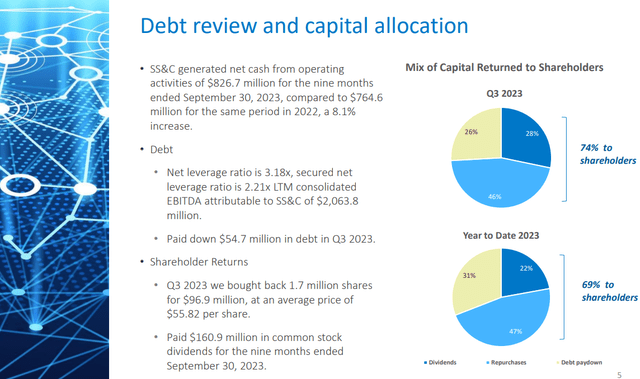
What’s Next For SSNC?
There are many moving parts here but our take is that SS&C Technologies is a good company with a high-quality stock that has simply been caught up on the wrong side of some high-level market themes.
We mentioned the weakness in investment management and private equity. The connection there is that a softer deal-making environment, particularly with interest rates at near two-decade high, ends up being a poor backdrop for the expansion of new business opportunities.
Major asset managers including Blackrock Inc (BLK) and Invesco Ltd (IVZ) have reported a slowdown in capital flows and otherwise poor assets under management dynamics. Similarly, major alternative investors and publicly-listed private equity firms like Blackstone Inc (BX) or KKR & Co Inc (KKR) are facing a lower earnings environment.
These types of names are benchmarks for SS&C’s customer base and highlight the ongoing headwinds. So while SS&C isn’t directly impacted by the market volatility or carries credit risk, that peripheral exposure is significant and clouds the outlook.
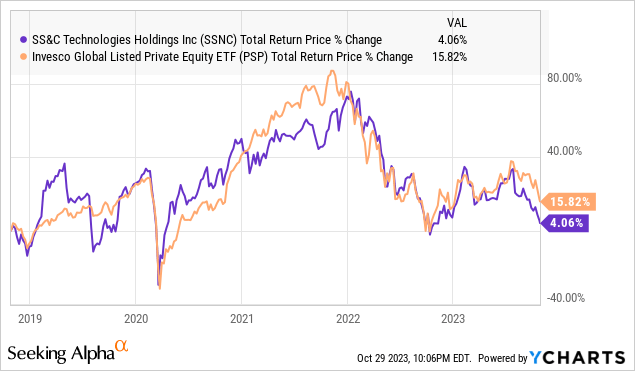
In other words, it’s not a coincidence that the stock price for SSNC has closely followed industry benchmarks like the Invesco Global Listed Private Equity ETF (PSP), underperforming the broader market since their pandemic highs.
The next step will largely depend on how the macro picture evolves. On the upside, a scenario where inflation surprises to the downside faster than expected, while the economy remains resilient could open the door for lower interest rates. Here we might expect sentiment to improve for investment management as a tailwind for SS&C.
On the downside, the potential that economic conditions deteriorate, possibly driven by further financial tightening, would likely pressure the operating environment and demand for its key services.
Is SSNC Undervalued?
On the question of whether shares are undervalued, the data we’re looking at is open to interpretation depending on how investors see SS&C positioned in the market.
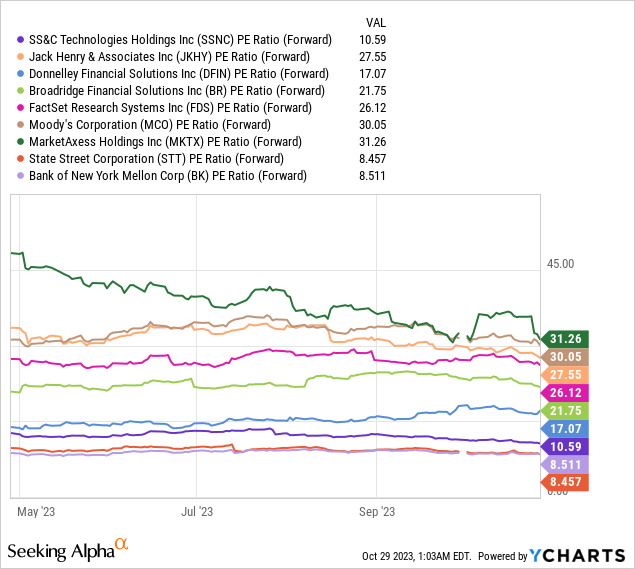
Trading at a forward P/E around 11x, it is clear the stock is at a large discount to other tech providers within financial services like Jack Henry & Associates Inc (JKHY), Donnelley Financial Solutions Inc (DFIN), and Broadridge Financial Solutions Inc (BR) with an average multiple above 20x.
It appears the market is pricing SSNC more like a traditional custodian bank such as State Street Corporation (STT) and Bank of New York Mellon Corp (BK) which trade at a P/E ratio closer to 8x. These companies are cited in SS&C’s annual report as competitors for hedge funds and private market services.
One thought is that with these markets otherwise “mature”, it makes sense that SS&C has already captured the low-hanging fruit of potential customers and even major strategic acquisition targets. This means that the growth upside is relatively limited to expanding an existing business.
We’d also point to intense competition by start-up solutions for specialized solutions at each end market that make market share gains incrementally more difficult. In our view, if SS&C is undervalued, it would need to be more based on an upside to current growth and earnings estimates beyond any significant multiples expansion.
Final Thoughts
Putting it all together, we rate SS&C as a buy with a cautiously bullish view that shares will ultimately be trading higher by this time next year.
The bullish case is that market conditions improve going forward and SS&C can capitalize with the effective execution of its expansion strategy. Monitoring points here include organic growth rates in the underlying business segments along with trends in the operating margin as a driver of profitability.
Credit: Source link