












































grandriver
Introduction
Oklahoma City-based Chesapeake Energy Corporation (NASDAQ:CHK) announced its second quarter of 2023 on August 1, 2022. CHK is expected to announce its third-quarter earnings post-market on October 31st.
Note: This article updates my May 24, 2022, article. I have followed CHK on Seeking Alpha since December 2019.
The Marcellus, Haynesville, and Eagle Ford shale plays (sold in August) are among the most productive in the world. CHK is a gas exploration and production company with assets in these areas. Unfortunately, 96% of the company’s total revenues come from natural gas, which I consider a major weakness.
However, on August 14, 2023, Chesapeake Energy announced that it sold its remaining Eagle Ford assets to SilverBow Resources, Inc. (SBOW) for $700 million, bringing the total proceeds from its Eagle Ford exit to more than $3.5 billion.
Additionally, Reuters reported on October 17, 2023, that Chesapeake Energy and Southwestern Energy Company (SWN) had discussed a potential $12 billion merger, including debt, to become “the largest natural gas-focused exploration and production company in the United States by market value, at a time when shale companies are seeking scale and efficiencies.”
Although it is too soon to make a good judgment on the matter, my gut feeling is that if the merger is announced, CHK will decline by at least 5%.
One important aspect of CHK to consider is its dividend and share buyback policy. The quarterly dividend was set at $0.575 per share, or a 2.6% yield. In Q2 2023, the company bought back shares for $125 million this quarter.
CHK Dividend and buyback policy (CHK Presentation)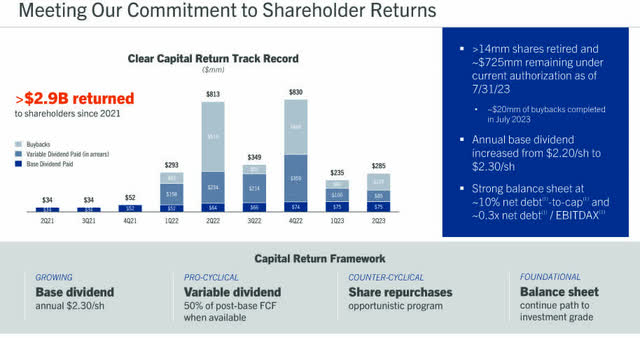
Natural gas prices are weakening after a good rally over the past few months. Despite the fact that the balance sheet currently appears to be strong, the outlook for natural gas prices is not very optimistic, and Chesapeake Energy Corp.’s future quarters will be difficult, especially with gas production expected to be lower.
The prospect of milder weather in the East compared to the West will also reduce demand for natural gas for heating and cooling, putting pressure on pricing.
CHK 1-Year Chart Brent versus NG Price (Fun Trading StockCharts)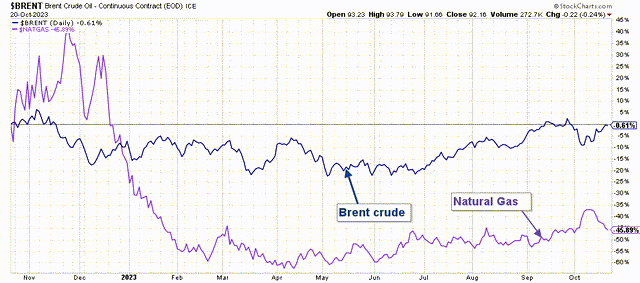
Furthermore, the company warned of lower production for the second half of 2023.
While our second quarter production reached the high end of our quarterly guidance at approximately 3.7 Bcf per day, our second half 2023 activity will be approximately one-third lower than our first half as measured by rig spuds, completions and CapEx.
All those early signs seem to indicate a possible stock breakdown unless the geopolitical situation in the Middle East boosts the bottom line. Hence, it is prudent to take profit on any uptick and wait patiently for a meaningful retracement to accumulate again.
Q2 2023 Results Snapshot
Chesapeake Energy Corp. reported a second-quarter income of $391 million, or 2.73 per diluted share, after declaring $1,237 million in the same period a year earlier.
The company posted earnings adjusted for non-recurring costs of $0.44 compared to a year earlier.
Total revenues were $1,419 million, and revenues, including gains on the sale of assets, were $1,891 million, significantly lower compared to Q2 2022.
Below are the highlights from the presentation:
CHK 2Q23 Highlights (CHK Presentation)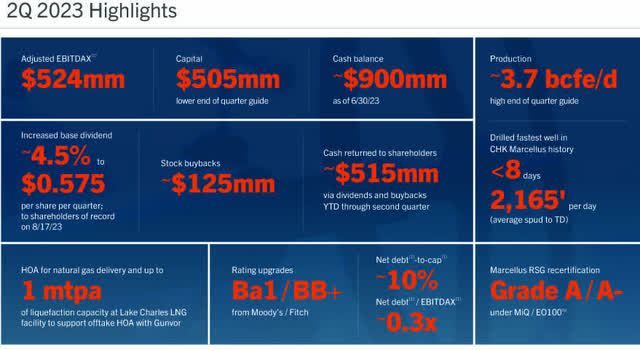
CEO Nick Dell’Osso said in the conference call:
We had an outstanding operating results this quarter, and we continue to execute on our strategy and deliver sustainable value to shareholders through cycles. Our performance at the field level remains strong, and I’m pleased that our team continues to find innovative ways to enhance our basin-leading operating performance.
2: Stock performance
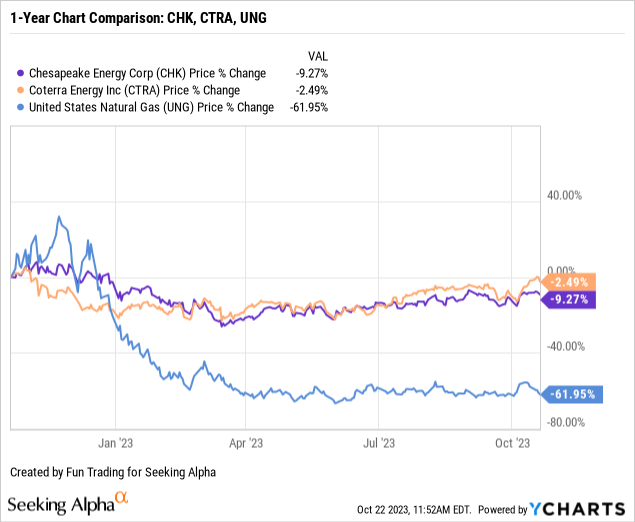
CHK is down 9% on a one-year basis and has slightly outperformed Coterra Energy Inc. (CTRA) and particularly The United States Natural Gas ETF, LP (UNG).
Note: I strongly recommend reading my recent article on CTRA published on September 26, 2023, by clicking here.
Chesapeake Energy Q2 2023 Quarterly Financial Table: The Raw Numbers
| Chesapeake CHK | 2Q22 | 3Q22 | 4Q22 | 1Q23 | 2Q23 |
| Total Revenues: $ Million | 3,499 | 3,164 | 4,124 | 3,035 | 1,891 |
| Net income in millions | 1,237 | 883 | 3,580 | 1,389 | 1,419 |
| EBITDA $ Million | 1,801 | 1,450 | 2,684 | 2,222 | 919 |
| EPS diluted in $/share | 8.27 | 6.12 | 24.00 | 9.60 | 2.73 |
| Operating cash flow in millions | 909 | 1,313 | 1,050 | 889 | 515 |
| CapEx in $ Million | 415 | 540 | 524 | 497 | 530 |
| Free Cash Flow in the Million | 494 | 773 | 526 | 392 | -15 |
| Cash and cash equivalent $ Million | 17 | 74 | 130 | 130 | 903 |
| Long-term Debt (including short-term) in billions | 3.046 | 2.717 | 3.093 | 2.040 | 2.036 |
| Shares outstanding (diluted) in millions | 149.53 | 144.39 | 148.75 | 144.73 | 143.27 |
| Quarterly dividend: $ per share | 2.32 | 3.16 | 1.29 | 1.18 | 0.575 |
| Oil-equivalent production | 2Q22 | 3Q22 | 4Q22 | 1Q23 | 2Q23 |
| Oil Equivalent Production in K-Boepd | 688 | 685 | 675 | 678 | 609 |
| Oil equivalent price realized (composite) in $/Boe | 27.90 | 27.10 | 25.92 | 20.69 | 16.02 |
Source: Chesapeake Energy 10-Q and Fun Trading.
Analysis: Revenues, Free Cash Flow, Net debt, And Oil and Gas Production
1: Quarterly total revenues were $1,891 million in Q2 2023
CHK Quarterly Revenue History (Fun Trading)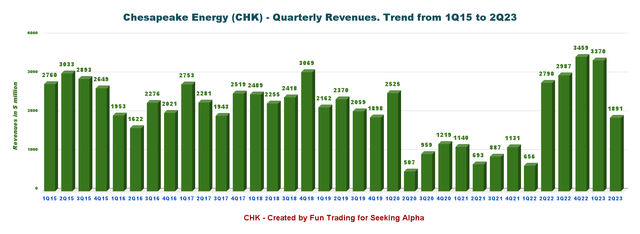
In the second quarter of 2013, Chesapeake reported net income of $391 million, or $2.73 per diluted share. $1,419 million in total revenues and $1,891 million in revenues, including gains from the sale of assets, were generated.
However, the business topped analysts’ average forecast on an adjusted basis, earning $0.64 per share.
2: Free cash flow was a deficit of $15 million in Q2 2023
CHK Quarterly Free Cash Flow History (Fun Trading)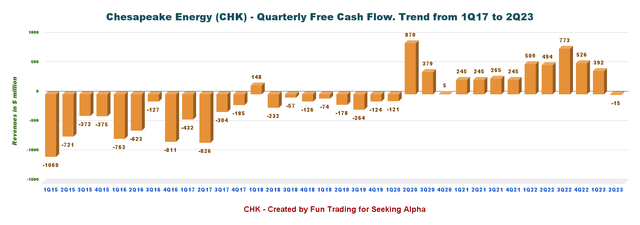
Note: The general free cash flow is defined as operating cash flow less capital expenditures.
The trailing 12-month free cash flow (“ttm”) was $1,676 million. For Q2 2023, there was a $15 million deficit in free cash flow on a quarterly basis.
3: Net debt is $1.133 billion in Q2 2023
CHK Quarterly Cash versus Debt History (Fun Trading)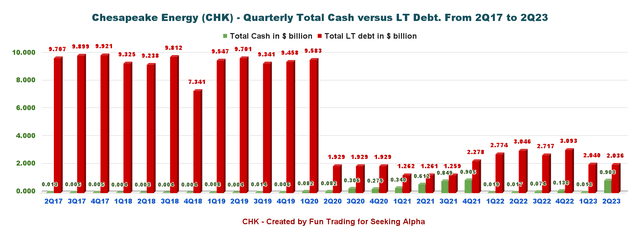
The company reported a total debt of $2.036 billion and cash and cash equivalents of $903 million. On June 30, 2023, the net debt stood at $1.13 billion.
CEO Nick Dell’Osso said in the conference call:
Today, our net debt to total cap is about 10%, and we received two recent upgrades from our credit rating agencies. We expect that our balance sheet will be further strengthened through the completion of our Eagle Ford exit
CHK Balance Sheet (CHK Presentation)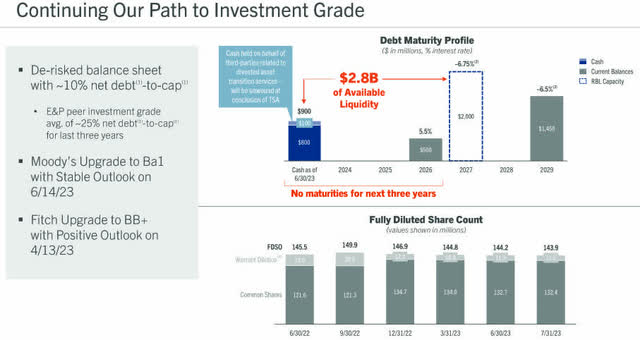
4: Quarterly Production was 3,653 MMCfe/d or 609.2K Boepd in Q2 2023
4.1: Produced approximately 3,653 MMcfe per day net in Q2 2023
CHK Quarterly Production History (Fun Trading)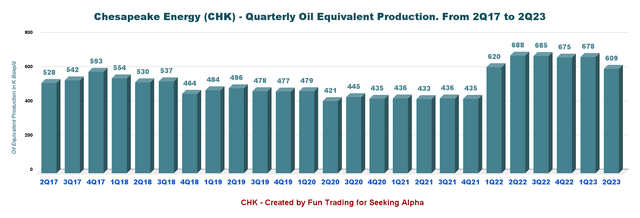
4.2: The price per boe (composite) was $16.02 [or $2.417 per million British thermal units BTU], much less than it was a year earlier when it was $27.90.
CHK Quarterly Oil price composite History (Fun Trading)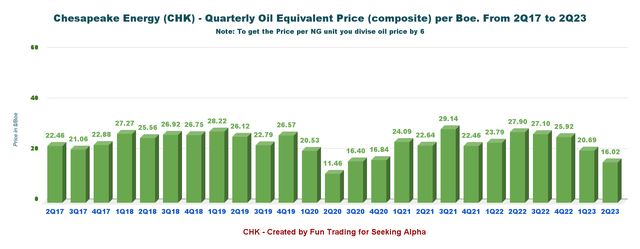
4.3: Below is the output in K Boepd per basin in Q2 2023.
The company produced from three locations in the USA, with oil and NGL production in the Eagle Ford Basin. However, CHK divested all its assets in the Eagle Ford Basin in August 2023.
CHK Quarterly Oil Production per Basin (Fun Trading)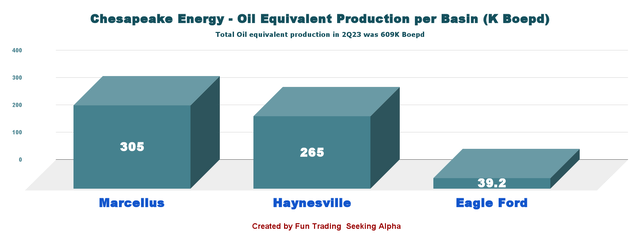
4.4: Chesapeake Energy mostly produces domestic gas. For the second quarter of 2023, 95.9% of all output was made up of natural gas production.
CHK 2Q23 Production per Segment (Fun Trading)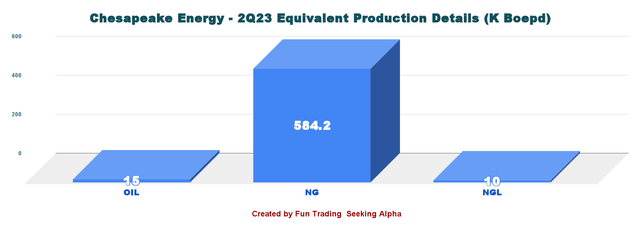
4.5-2023 activity reductions
Total natural gas production is expected to be 3,300-3,400 MMcf/d in Q3 2023, or an 8% lower QoQ.
CHK 2023 Guidance (CHK Presentation)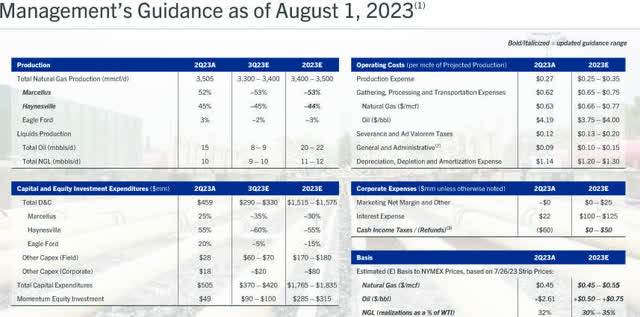
Technical Analysis (short-term) and commentary
CHK TA Chart (Fun Trading StockCharts)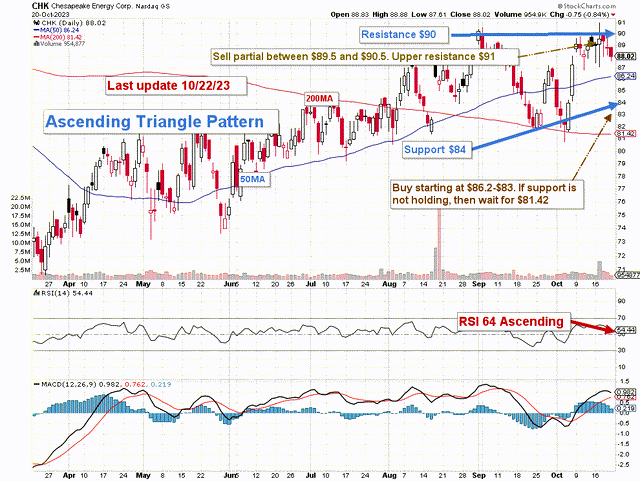
Note: The chart is adjusted for the dividend.
With support at $84 and resistance at $90, CHK forms an ascending triangle pattern.
An ascending triangle is a bullish chart pattern and is formed by a series of higher lows and an upper resistance level.
I typically advise using the trading LIFO technique of selling roughly 50% between $89.5 and $90.5 with potential higher resistance at $91 and considering accumulating between $86.2 and $83 with potential lower support at $81.42.
Watch the natural gas prices like a hawk.
Warning: The TA chart must be updated frequently to be relevant. It is what I am doing in my stock tracker. The chart above has a possible validity of about a week. Remember, the TA chart is a tool only to help you adopt the right strategy. It is not a way to foresee the future. No one and nothing can.
Credit: Source link









