

Ahmet Selcuk Ozel/iStock via Getty Images
Investment Thesis
Investing in Aspen Technology (NASDAQ:AZPN) is like a high-stakes poker game where the hand you’re dealt shows promise and peril. The company’s Licenses and Solutions segment has jumped from $180.9 million in 2021 to $669.2 million in 2023, and Maintenance revenue has similarly surged from $92.6 million to $316.9 million. However, this winning streak in revenue hasn’t translated into net profitability; instead, the net loss has actually grown from $20.6 million to $107.8 million. This is due to the operating margin declining at -17.5%, thanks to operating expenses that have expanded faster than the revenue.
A Discounted Cash Flow model paints a future of exponential revenue growth, projecting a jump from $1,044 million in 2023 to $5,180 million in 2028, and valuing the enterprise between $11,118 million and $15,552 million. With the current stock price at $199.06, the company appears to be fairly valued or potentially a bargain, depending on which DCF projections you believe.
So, what’s my recommendation? The prudent move is to “Hold.” Aspen Tech has to prove it can control its spiraling operating expenses and stabilize its balance sheet. The crucial metrics to watch is the operating margin and net working capital, as improvements in these areas could turn Aspen Tech into a less risky company.
Overview
Aspen Technology is a dominant player in the industrial software market that focuses on asset optimization. Aspen Technology has been helping companies operate more safely, sustainably, and efficiently. On October 10, 2021, AspenTech inked a significant deal with Emerson and its subsidiaries, involving a $6.014 billion cash and stock transaction that was finalized on May 16, 2022. This agreement not only broadened AspenTech’s market reach but also diversified its product offerings into five distinct suites.
However, a recent failed acquisition attempt of Micromine for AU $900 million exposed AspenTech’s sensitivity to geopolitical and regulatory risks. The failed acquisition of Micromine for AU $900 million (equivalent to $623 million) signals potential risks in global expansions, likely due to complex regulatory landscapes as evidenced by the snag in Russia. Moreover, the company’s use of foreign currency forward contracts indicates an exposure to currency risk, amplified by the failed Micromine deal. Additionally, about 84% of their ACV is denominated in U.S. dollars, suggesting geographical concentration risks.
On the financial front, the company is showing promising signs. As of June 30, 2023, AspenTech’s Annual Contract Value had grown approximately 11.8% to $884.9 million, and its Total Contract Value (TCV) stood robustly at $3.6 billion up from $3.2 billion the previous year, showcasing the company’s future revenue potential. These numbers indicate strong revenue predictability and financial health, backed by an 11.8% increase in ACV and a TCV of $3.6 billion. The company also announced a new share repurchase program worth up to $300 million, hinting at potential competitive pressures in the market that might impact long-term growth. Bookings, which represent future revenue, were also robust at $1.078 billion for the year ending June 30, 2023.
In terms of long-term prospects, the consistent growth in ACV and TCV and the strategic Emerson partnership make a strong case for the company’s sustainability. Yet, the Micromine debacle does cast a shadow. This investment stance is supported by deductive reasoning drawn from the ACV and TCV growth, inductive reasoning based on the failed Micromine acquisition as a sign of future regulatory risks, and abductive reasoning suggesting that the share repurchase program might be a strategic move to counter market competition and boost shareholder value.
Revenue Analysis
Author analysis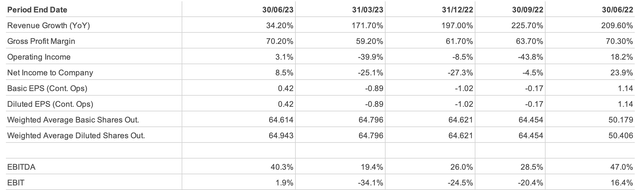
On the positive side, the revenue from Licenses and Solutions increased from $180,914,000 in 2021 to $669,185,000 in 2023, likely indicating a surge in new contracts or highly successful products. The Maintenance revenue increased from $92,562,000 to $316,911,000 over the same period, which could mean strong customer retention and potential upselling. Even the ‘Services and Other’ category experienced growth, from $27,164,000 to $58,082,000. Thus, the total revenue increased from $300,640,000 in 2021 to $1,044,178,000 in 2023. However, this hasn’t translated into profitability, as evidenced by the widening net loss from $20,608,000 in 2021 to $107,760,000 in 2023.
The devil is in the expenditures. The cost of revenue for Licenses and Solutions more than doubled to $279,564,000 in 2023, but given that the revenue in this sector nearly quadrupled, the numbers still spell efficiency.
The Gross Profit increased from $137,630,000 in 2021 to $670,589,000 in 2023. On the flip side, the operating margin is at -17.5%, hinting at inefficiencies in managing operating costs. Here comes the red flag: Operating Expenses swelled disproportionately from $198,069,000 to $853,654,000, leading to a troubling net loss of $107,760,000 in 2023, up from a net loss of $20,608,000 in 2021. This incongruity between the Gross Profit and Net Income raises questions about the sustainability of these earnings, especially when other comprehensive income factors like a foreign currency gain of $7,548,000 don’t significantly distort the net income.
Looking at a one-year forecast, if the company maintains its current revenue growth rate but doesn’t control the operating expenses, we can expect an even wider net loss based on the historical trend. Key value drivers for the company include its License and Solutions segment, which contributed $669,185,000 to the total revenue in 2023 and a gross profit that jumped from $137,630,000 in 2021 to $670,589,000 in 2023. The critical metric to watch here is the operating margin, currently at a concerning -17.5%.
Peering into the future, the trends in revenue streams and gross profit suggest the company is on an expansion spree and is successfully grabbing market share. However, it risks entering into solvency unless it tightens its operating expenses and leverages growth synergies effectively.
In summary, while the revenue and gross profit trajectories are bullish, the expanding net loss needs immediate attention for the company’s long-term financial health. Given all these factors, the best investment guidance at this point would be a “Hold” recommendation until the company shows it can control its operating expenses.
Balance Sheet Analysis
When i analyse the balance sheet, on the asset front, there’s been a decline of 20.5% in current assets from $1,047,490,000 in 2022 to $833,064,000 in 2023. This drop is particularly pronounced in cash and cash equivalents, which plummeted by 45% from $449,725,000 to $241,209,000. While accounts receivable saw a modest increase from $111,027,000 to $122,789,000, suggesting that customers are generally paying their bills, current contract assets dipped from $428,833,000 to $367,539,000. This decline in current assets could signal liquidity issues. However, the company is on solid ground in terms of long-term assets, with goodwill and intangible assets totaling a substantial $8,330,811,000 and $4,659,657,000, respectively, indicating a strong portfolio of intellectual property or brand value.
On the liabilities front, there was a 17% increase from $300,936,000 in 2022 to $352,427,000 in 2023. The current liabilities increased from $300,936,000 in 2022 to $352,427,000 in 2023. Although accounts payable decreased slightly, implying effective short-term obligation management, the income taxes payable soared from $6,768,000 to $46,205,000, setting off potential alarm bells. On the flip side, deferred tax liabilities and non-current borrowings have seen a reduction.
When it comes to stockholders’ equity, the picture is slightly disturbing. Although common stock remained consistent and additional paid-in capital increased, the company shifted from having positive retained earnings of $66,369,000 to an accumulated deficit of $41,391,000. Financial ratios further underscore these points. The current ratio stands at approximately 2.36 in 2023, which is considered healthy, yet the negative Return on Equity of -0.8% and the shift to an accumulated deficit raises questions about the sustainability of earnings. The debt-to-equity ratio is quite low at 2.7%, suggesting the company has a low-risk profile in terms of long-term obligations. Yet, it’s the current ratio, now at 2.36, that deserves the most scrutiny in the coming period, especially if assets continue to decline and liabilities rise.
In summary, the company’s long-term assets could signal future growth, but immediate concerns related to liquidity and earnings sustainability cannot be ignored. The substantial drop in cash, coupled with a surge in income taxes payable and a move to an accumulated deficit, suggests that stakeholders should exercise caution and closely monitor these areas. Due to these financial red flags, the recommendation would be to “Hold” for now until the company stabilizes its financials.
Free Cash Flow Analysis
Author analysis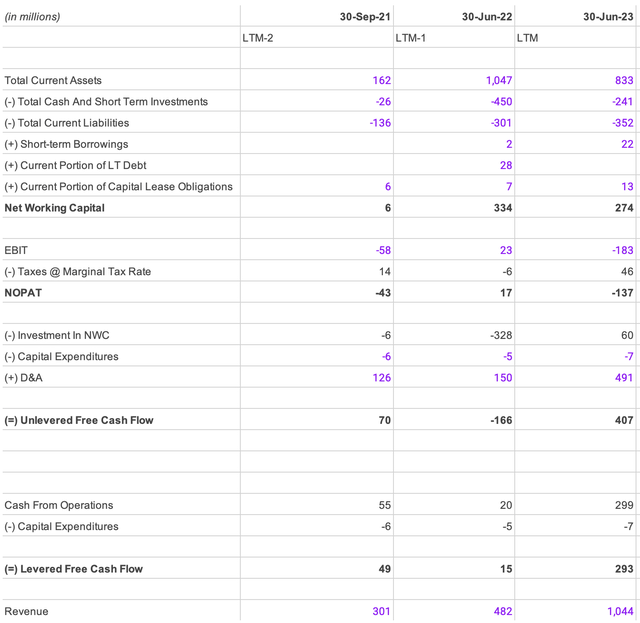
The total current assets have shrunk significantly from $1,047 million in 2022 to $833 million in 2023, marking a 20.4% decline. This contraction raises immediate liquidity concerns, especially when coupled with an 18% dip in net working capital—from $334 million to $274 million over the same period. However, revenue nearly doubled, from $482 million in 2021 to $1,044 million in 2023.
Starting with operating activities, Cash From Operations showed an increase from $55 million in 2021 to $299 million in 2023. While this growth initially appears promising, a deeper look reveals concerns about its sustainability. Specifically, EBIT went from a negative $58 million in 2021 to a positive $23 million in 2022, only to decline to a negative $183 million in 2023. This erratic behavior casts a shadow over the quality and longevity of the recent surge in cash from operations.
Turning to investing activities, the company’s capital expenditures remained relatively stable yet low, ranging from $6 million in 2021 to $7 million in 2023.
When it comes to financing activities, the company seems to be increasingly reliant on short-term borrowings, which shot up from zero in 2021 to $22 million in 2023. In contrast, the current portion of long-term debt dropped from $28 million in 2022 to zero in 2023, suggesting a shift toward short-term financing that could raise questions about the company’s long-term financial stability. The company’s debt structure also shows signs of strain. Short-term liabilities have increased from $301 million in 2022 to $352 million in 2023, and short-term borrowings jumped tenfold from $2 million to $22 million.
Net Operating Profit After Taxes (NOPAT) declined from $17 million in 2022 to a negative $137 million in 2023. Despite this, unlevered free cash flow increased from $70 million in 2021 to $407 million in 2023, revealing a discrepancy between earnings and cash flows.
The quality of the company’s earnings also warrants scrutiny. While the revenue growth is a positive indicator of value, it’s crucial to examine whether this growth is sustainable, especially in the face of declining profitability metrics like EBIT and NOPAT. One red flag is the significant discrepancy between NOPAT and unlevered free cash flow, which could be indicative of lower earnings quality.
Given the existing trends, the company may continue to struggle with diminishing working capital and EBIT in the near future, and the key metric to keep an eye on would be net working capital. A continued decline in net working capital could hamper day-to-day operations and compromise the company’s ability to meet short-term financial obligations.
In summary, while there are promising signs, like the substantial increase in Cash From Operations in 2023, several red flags cannot be ignored. The dramatic fluctuations in EBIT and NOPAT, coupled with a shift toward short-term borrowings and low capital expenditures, call for close attention to the company’s financial health and sustainability. Given these mixed indicators, stakeholders should proceed with caution.
In terms of investment guidance, the prudent course of action would be to adopt a “Hold” stance until there’s evidence of financial stabilization. Despite promising revenue growth, the company’s deteriorating profitability and liquidity metrics warrant close scrutiny.
Shareholder Yield
Author analysis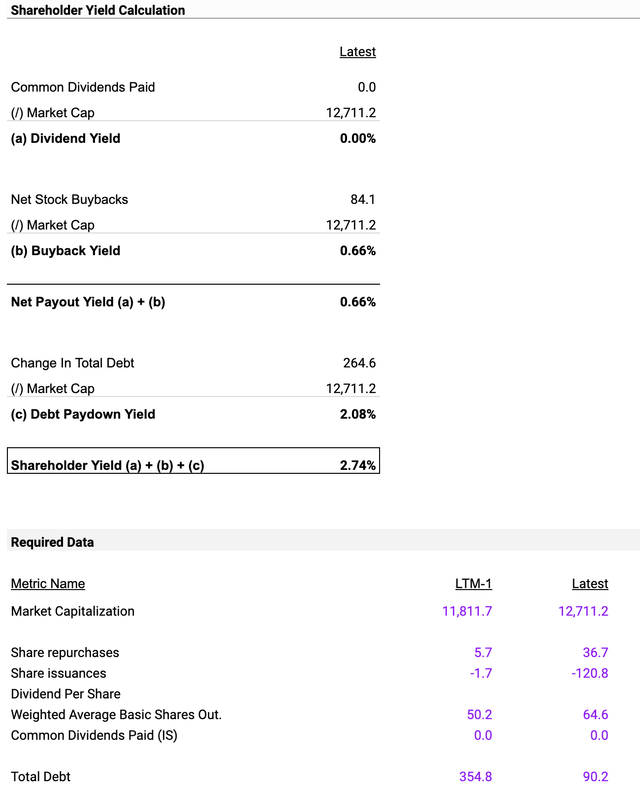
The company’s Shareholder Yield is at 2.74%, a composite of its Dividend Yield, Buyback Yield, and Debt Paydown Yield. Notably, its Dividend Yield is zero, suggesting no returns to shareholders through dividend payouts. The Buyback Yield is relatively modest at 0.66%, but what catches the eye is the Debt Paydown Yield at a substantial 2.08%. This signals that the company is making a concerted effort to reduce its debt. While the absence of dividends might set off alarms for those seeking income from their investments, the higher Debt Paydown Yield compared to Buyback Yield indicates a stronger focus on liability management over shareholder returns.
Looking ahead, if we assume that the current Debt Paydown Yield of 2.08% remains stable, it’s reasonable to expect that the company will continue prioritizing debt reduction in the near term. This debt reduction strategy appears to be the main driver of value for the company right now, but its sustainability hinges on the company’s ability to maintain robust cash flows.
The critical metric to keep an eye on is the Debt Paydown Yield; a significant shift in this figure could reveal a change in the company’s capital structure strategy. As for the company’s financial health, the focus on debt reduction likely aims to boost liquidity and solvency, especially since dividends are not currently part of the shareholder yield. This can be seen as a conservative risk posture, aligning with the Debt Paydown Yield of 2.08%.
The modest Buyback Yield of 0.66% indicates some level of shareholder return through stock buybacks, but it’s not a dominant strategy. The glaring financial risk, from the perspective of potential investors, is the non-payment of dividends.
As for investment advice, the prudent course of action seems to be to ‘Hold’ until there are clearer signs of financial stability or a more aggressive approach to creating shareholder value. Given this landscape, closely watching the Debt Paydown Yield and any changes in the Buyback Yield could offer valuable insights for future investment decisions.
Commentary on Upcoming Earnings
Seeking Alpha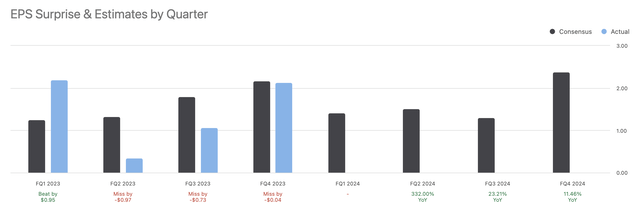
The company will announce its next quarter earnings on 26th October 2023. For the quarter ending on 30/9/2023, both revenue and EPS are forecasted to decline, raising concerns about the company’s ability to generate sales and maintain profitability. Specifically, the median revenue forecast is $269.3 million, a decrease from the previous quarter’s $326.8 million.
The median EPS forecast for the upcoming quarter is $1.42, compared to $2.17 in the previous quarter, with the low and high EPS forecasts also decreasing from $2.1 and $2.27 to $1.12 and $1.79, respectively.
Taken together, these forecasts suggest a challenging quarter ahead and warrant caution for investors.
Discounted Cash Flow Valuation
I value the company using discounted cash flow valuation. Following are my assumptions for the DCF model.
Author analysis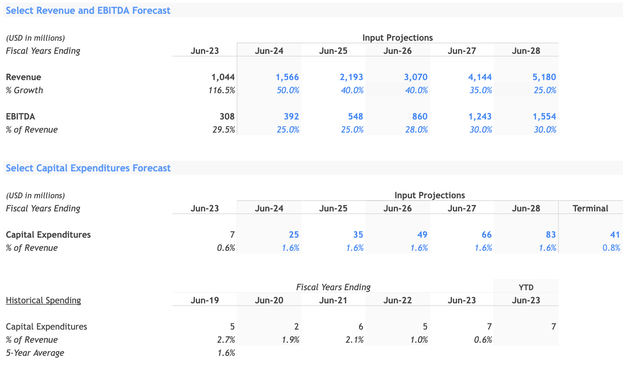
Revenue:
The revenue is projected to grow from $1,044 million in June 2023 to $5,180 million in June 2028. The company grew by 116.5% last year. The initial high growth rate could be justified as the company is in a high-growth industry. I assume the company will grow by 50% next year due to the higher bookings of $1.078 billion, with TCV’s value at $3.6 billion. As the company matures, the growth rate will stabilize to 25% by 2028.
EBITDA:
EBITDA starts at $308 million in June 2023 and is expected to reach $1,554 million by June 2028. I assume that as the growth is already happening, the company will focus on its cost structure to improve EBITDA margins. In 2023, the company has a 29.5% EBITDA margin, and i assume that it will decline to 25% for the next two years due to the higher operating expenses but will stabilise to 30% in the fifth year when the company starts to control its operating expenses.
Capital Expenditures:
Capital expenditures are a small percentage of revenue, ranging from 0.6% to 1.6% over the years. Given the 5-Year Average is 1.6%, this seems to be a reasonable estimation.
Author analysis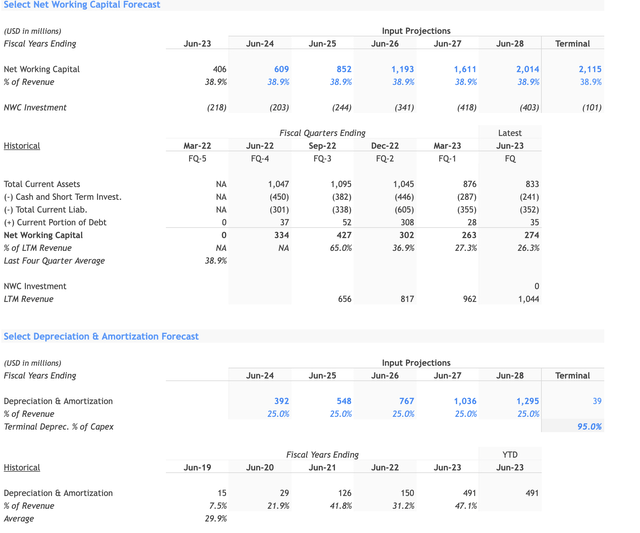
Net Working Capital:
Net working capital as a percentage of revenue is constant at 38.9%, which is consistent with the Last Four Quarter Average of 38.9%. This looks reasonable.
D&A as a percentage of revenue:
The model assumes a consistent 25%, consistent against historical or industry averages.
Author analysis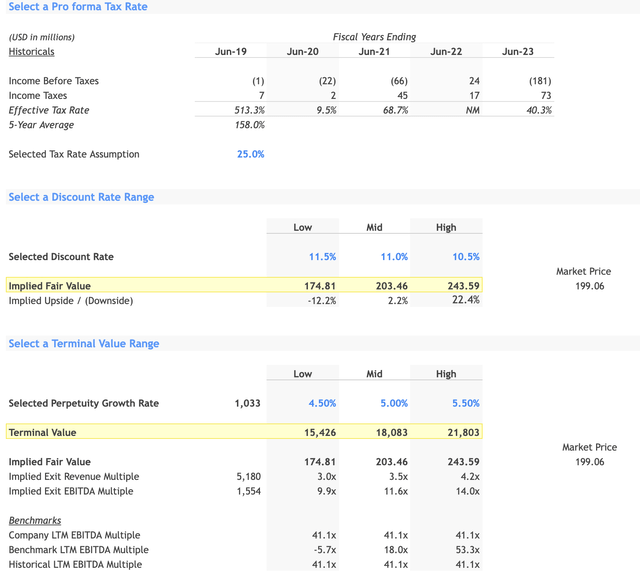
Pro forma Tax Rate:
A tax rate of 25% is assumed, lower than the 5-Year Average effective tax rate of 158%. This assumption is aligned to the long-term tax rate for the US.
Discount Rate:
The discount rate ranges from 10.5% to 11.5%.
Terminal Value:
Perpetuity Growth Rate:
The model uses a perpetuity growth rate ranging from 4.5% to 5.5%. This is an assumption about how the company will grow indefinitely and should be less than the long-term growth rate of the economy.
Justification:
The terminal value is calculated based on these growth rates and gives a range from $15,426 million to $21,803 million. It represents the company’s value into perpetuity and is a significant part of the overall valuation.
Author analysis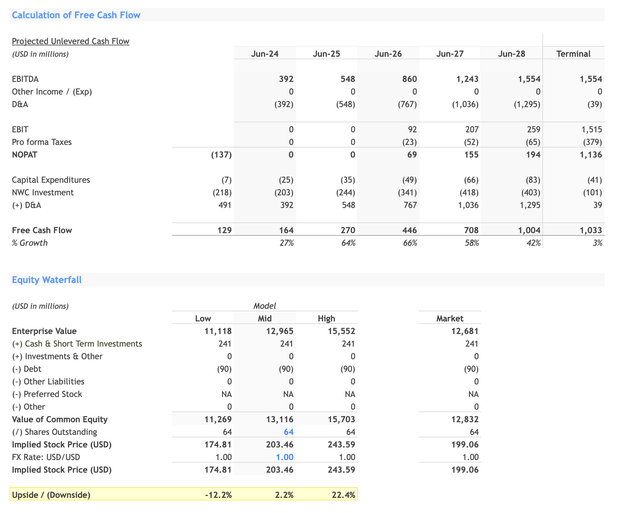
Calculating Free Cash Flows:
Free Cash Flow is calculated using EBITDA, capital expenditures, and NWC Investment. The FCF grows from $129 million in June 2024 to $1,004 million in June 2028, indicating healthy growth and potential for value creation. The growth rate starts at 27% and reduces to 3% by the end, which might indicate a maturing business.
Valuation Results:
The final enterprise value ranges from $11,118 million to $15,552 million. The implied stock price ranges from $174.81 to $243.59. Given the current market price of $199.06, the stock appears to be fairly valued according to the mid-range model but undervalued according to the high-range model.
Investment Recommendation:
In evaluating Aspen Tech as an investment opportunity, several key factors stand out. First, the company has seen remarkable revenue growth, soaring from $300.64 million in 2021 to $1,044.18 million in 2023. While this indicates a strong market presence, especially in the Licenses and Solutions segment which alone accounted for $669.18 million in 2023, it’s not all sunshine and rainbows. The company is still operating at a loss, with net losses deepening from $20.6 million in 2021 to $107.76 million in 2023. A deeper dive reveals that operating expenses have surged from $198.07 million to $853.65 million over the same period, suggesting that the company is not spending efficiently.
Turning to valuation, the Discounted Cash Flow model reveals an implied stock price range of $174.81 to $243.59. With the current market price sitting at $199.06, the stock appears fairly valued at the midpoint but undervalued at the high end.
Now, let’s consider financial health. The company’s current assets have declined by 20.5%, with a particularly alarming 45% drop in cash and cash equivalents. These are red flags for liquidity. On the other hand, Aspen Tech seems well-positioned in terms of long-term assets, boasting $8.33 billion in goodwill and $4.66 billion in intangible assets. Yet, these significant long-term assets could also mean the company might struggle with short-term obligations. Management efficiency also raises concerns, with an operating margin of -17.5%, signaling that the company has room for improvement in managing its operating costs for long-term sustainability.
Given these insights, a medium to long-term investment approach seems most appropriate for now. In summary, while Aspen Tech shows promise in revenue growth and has a solid market position, the lack of profitability and operational inefficiency make it a risky venture at this time. Therefore, the most prudent investment action is to ‘Hold’ the stock, at least until the company shows signs of reigning in its operating expenses and stabilizing its financial health.
Credit: Source link