
GOCMEN
I expect Chinese stocks to decline significantly over the coming year for several reasons, including a) China faces major geopolitical tensions with the USA, b) China’s real estate bubble is bursting, c) China and global recession risk, d) it is difficult for the Chinese government to “stimulate” its economy due to high debt/GDP and falling yuan and e) Chinese stocks are trading at historically high valuation levels.
To profit from this, I recommend buying the Direxion Daily FTSE China Bear 3X Shares ETF (NYSEARCA:YANG), since it is constructed to return 3x the inverse of the daily return of the FTSE China 50 Index (the “Index”).
Investment Thesis
I recommend Direxion Daily FTSE China Bear 3X Shares ETF with a Buy.
If the FTSE China 50 falls at least 30%, YANG could double or more in price, which would likely make it one of the best-performing investments in a coming global recession I expect.
I believe buying an inverse ETF like YANG is better than shorting an ETF like the iShares China Large-Cap ETF (FXI) since it requires no margin account, which means no borrowing, no interest expense, and no margin calls. It is also more intuitive since investors generate profits when YANG rises in price and incur losses when it falls in price, just like with traditional stocks and ETFs.
One key issue to understand before buying any levered ETF such as YANG is that they often underperform their benchmark by the leverage factor, which in the case of YANG is -3x. This is primarily due to “beta slippage”, which occurs during periods of high daily volatility. For example, if the Index rises 10% one day and falls 10% the next day, it will be down -1% [(1 + 0.10) x (1 – 0.10) = 0.99] over that two-day period. But if a -3x levered ETF like YANG falls 30% the first day and rises 30% the second day, it will be down -9% [(1 – 0.30) x (1 + 0.30) = 0.91] over that two-day period, instead of the +3% one would expect it to rise. This is due to the mechanics of daily leverage pricing.
ETF Overview
The Direxion Daily FTSE China Bear 3X Shares ETF seeks three times the inverse of the performance of the FTSE China 50 Index on a daily basis. That means if the Index rises 1% on a given day, then YANG should fall about 3%. And if the Index falls 1% on a given day, then YANG should rise about 3%.
YANG achieves this daily performance goal primarily by using swap agreements with large financial institutions such as JP Morgan, Bank of America and Citibank, as well as futures contracts and other financial instruments.
Due to the compounding of daily returns, this triple inverse ETF is not likely to generate three times the inverse of the return of the Index cumulative return for periods lasting more than one day. In low-volatility markets that are primarily trending in one direction, the cumulative return for longer periods will typically be higher than -3x the return of the Index. But for high volatility markets without a strong trend, the cumulative return for longer periods will typically be lower than -3xthe return of the Index due to the mechanics of daily leverage pricing, as discussed above.
YANG has total assets of $131.2 million. But it is larger than the $20.7 million competing ProShares UltraShort FTSE China ETF (FXP). Note that FXP is a -2x levered ETF, which is less leverage than YANG at -3x. YANG average daily dollar volume is $52.7 million, which is much higher than the $0.5 million of FXP. The expense ratio is relatively high at 1.08%, which is higher than 0.95% expense ratio of FXP. The average bid-ask spread is relatively low at 0.08%, but it is lower than the 0.24% spread of SSG.
The Index is comprised of 50 of the largest and most liquid Chinese stocks. It is not possible to invest directly in the Index, but one can invest in traditional China ETFs such as the iShares China Large-Cap ETF.
High Risk In Chinese Stocks
I believe Chinese stocks are at high risk now for five key reasons:
- China faces major geopolitical tensions with the USA
- China’s real estate bubble is bursting
- China and global recession risk
- It is difficult for the Chinese government to “stimulate” its economy due to high debt/GDP and falling yuan
- Historically high Chinese stock valuation levels
While the Chinese people are highly educated and hard working and China’s shift away from communism towards free markets in recent decades has been very successful, I believe the Chinese economy remains far too controlled by the government and its credit-fueled bubble is bursting. Investors can profit from this ongoing bear market by buying YANG.
China Geopolitical Tensions With The USA
There are rising geopolitical tensions between China and the US. Since the US is China’s largest customer, representing 17% of its exports, any disruption of trade between the two countries would harm China’s economy.
Due to concerns over unfair trade practices and national security, the Trump and Biden administrations have been waging a trade war with China. The US has imposed various tariffs, export controls, sanctions and investment bans on Chinese companies and industries, including telecom companies like Huawei and chipmakers, drone makers and genomics companies.
Another source of conflict is Taiwan. China claims Taiwan is part of China, but the US supports Taiwan’s independence and supplies Taiwan with weapons. China recently sent 103 warplanes and nine navy ships toward Taiwan after the US and Canada sailed warships through Taiwan straight. Needless to say, a war between the US and China would not likely be bullish for Chinese stocks.
China’s Real Estate Bubble Is Bursting
China’s massive real estate bubble is bursting and real estate developers are in a major debt crisis. China’s housing market represented 25% to 30% of GDP at its peak.
The chart below shows as of July, China’s real estate investment declined 17%, home sales declined 20% and home starts declined 35% year-over-year.
IMF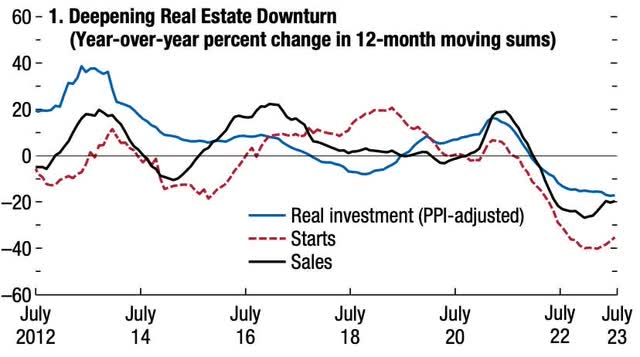
According to a recent IMF report:
High-frequency indicators suggest further weakness with the property sector crisis in the country leading the factors hampering growth. Country Garden- China’s largest property developer and a major beneficiary of government support-is facing severe liquidity stress, a sign that real estate distress is spreading to stronger developers, despite policy easing measures. Property developers face severe funding constraints, preventing them from completing presold homes. This is undermining home buyer confidence and prolonging the property sector downturn. Meanwhile, real estate investment and housing prices continue to decline, putting pressure on local governments’ revenues from land sales and threatening already fragile public finances.”
China and Global Recession Risk
Chinese economic indicators are very weak and growth forecasts are being cut after a disappointing re-opening following their disastrous “zero covid” policies.
The chart below shows China’s GDP relative to trend is declining at the fastest pace since the Global Financial Crisis of 2008-2009 (outside of the covid panic of 2020).
OECD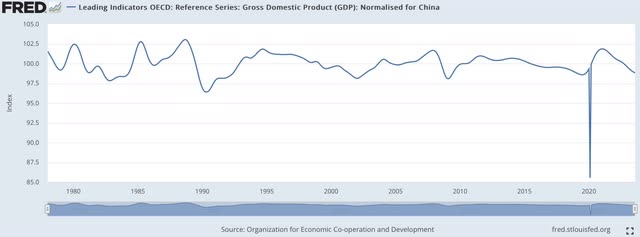
Youth unemployment has doubled over the past five years to a record high of 21%. Exports and imports both fell 6.2% in September due to the weakening global economy.
China’s manufacturing sector is weak. New export orders and manufacturing employment continue to be below the neutral 50 level in the latest PMI report, indicating contraction, as shown below.
S&P Global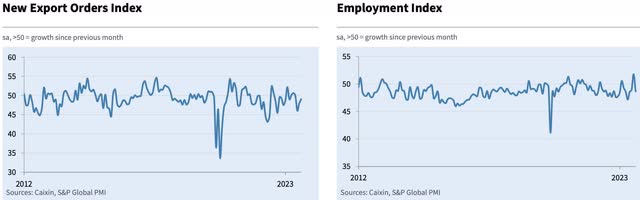
According to the September Caixan China General Manufacturing PMI report:
Manufacturing conditions across China improved slightly for the second consecutive month in September…[but] confidence regarding the year-ahead remained relatively subdued, which in turn contributed to a drop in employment at Chinese manufacturing plants….After rising in August, manufacturing employment in China declined in September…[M]uted global economic conditions weighed on overall growth forecasts.”
A useful leading indicator for China’s economy is The Conference Board’s China Leading Economic Index (“LEI”). It is highly regarded for its ability to predict recessions and recoveries. The following chart shows The Conference Board’s China LEI has been and continues to be at recessionary levels.
The Conference Board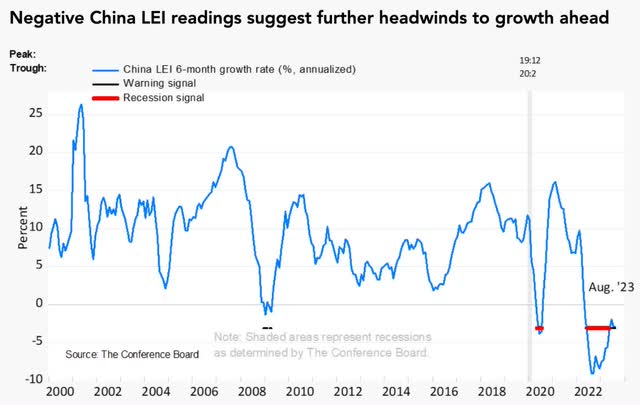
According to Ian Hu, Economic Research Associate at The Conference Board:
The China LEI declined again in August, suggesting further obstacles to growth. Although the profitability index improved slightly, the change was not enough to offset deteriorating consumer expectations, likely reflecting weakening labor market conditions and the continued housing downturn. Over the past year, the 6-month changes for consumer expectations and exports have been consistently negative. As such, we predict that headwinds to growth will persist; the Conference Board projects year over year GDP growth of 4.8 percent in 2023, which is downwardly revised from a previously projected 5.1 percent growth rate.”
While many economists and business cycle experts expect a Chinese and global recession, I do not believe that is priced into the market yet, given the high stock valuation levels discussed below.
Typically before a recession starts and even many months after a recession has started, most investors are not aware of the risks of a recession, since they tend to focus more on coincident or lagging indicators such as GDP and employment, as well as historical earnings reports, rather than leading economic indicators. It is usually only after unemployment starts rising materially and companies start missing or guiding down revenues significantly that investors begin to panic and price in recession risks.
YANG can perform very well during a sharp drop in Chinese stocks. During the covid stock market panic of February and March 2020, Chinese stocks, as represented by the FXI ETF, fell -27%. YANG rose +103% then. That was -3.8x the return of FXI.
Of course, with -3x levered ETFs, performance can vary significantly, particularly when prices are highly volatile. For example, FXI fell -21% in 2022, but YANG fell -41%, which is +1.95x the return of FXI and not the -3x expected! Thus, it is very important for investors to recognize that YANG performance can stray significantly from what is expected over medium to long periods of time.
Difficult To “Stimulate” China’s Economy
As it is for the US now, it will also be challenging for China’s government to “stimulate” the economy with more money creation, given the country’s high 280% debt/GDP ratio.
The IMF recently warned that “the U.S. and China will both need to make major changes to put their medium-term debt and deficit on a sustainable path” and “continuing along their projected fiscal paths will ultimately cause difficulties for the world’s two largest economies”. In addition, “Chinese authorities need to pay more attention to growing debt at the sub-national government level and in local financing vehicles, and work to reduce the country’s long dependence on real estate and infrastructure investment for growth.”
It will also be difficult for China to create more money out of thin air due to their need to defend the value of the yuan, which has fallen 14% over the past 18 months.
High Chinese Stock Valuation Levels
My preferred valuation indicator for any country’s stock market – as well as Warren Buffett’s – is the ratio of total stock market value to GDP. China’s valuation ratio is currently over 80%. This is the highest level of any period in the past 30 years, other than the years preceding the Global Financial Crisis, as shown in the chart below. This makes Chinese stocks very vulnerable to disappointing fundamentals.
Trading Economics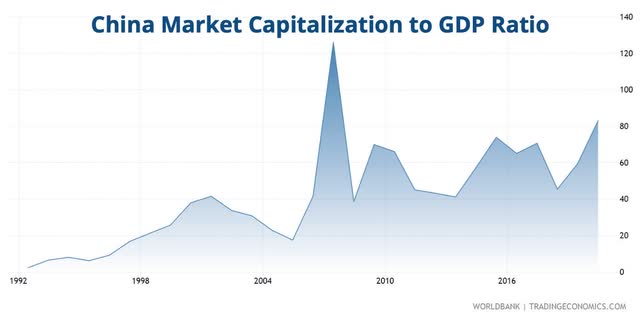
Valuation levels for any investment are primarily useful for determining long-term return potential and are usually not indicative of likely short-term returns. However, I believe they are very relevant for stocks in a recession since valuations tend to fall significantly when fundamentals are weak.
Risks
Triple inverse ETFs such as YANG carry substantial risks, as discussed on the fund’s website here and here.
They are only suitable for aggressive investors who can actively manage their trading positions and tolerate large losses in a short period of time. They are not suitable for “buy and hold” long-term investing since stocks tend to rise over time. They should only be held during periods when an investor has strong conviction that the underlying Index will be declining in a bear market. I have that conviction now.
If the Index is highly volatile, the return of YANG could be negative, even if the Index falls. And if the Index rises more than 30% in one day – which I believe is highly unlikely – then the value of YANG could fall to $0. However, the ETF manager typically positions the fund so that it is not responsive to changes in the Index of more than 30% on a given trading day. This should limit the maximum daily gain or loss of YANG to 90%.
There are also risks related to the derivatives that YANG invests in, as well as the counterparty risk they undertake with those derivatives. If there is a major global financial crisis, which would typically lead to gains for YANG, there could be a risk that the financial institutions that are counterparties to YANG swap agreements and other derivatives are not able to meet their commitments.
Beyond the risks relating to the fund, the primary risk to YANG is if there is no China recession and our other concerns are alleviated.
To mitigate those risks, investors in YANG should closely monitor China’s leading economic indicators and China’s news.
In the short term, there is always the risk of sharp bear market rallies.
Investment Recommendation
I recommend YANG ETF with a Buy due to my expectations of a significant decline in Chinese stocks due to China facing major geopolitical tensions with the USA, the bursting of China’s real estate bubble, China and global recession risk, the difficulty China’s government has to “stimulate” its economy due to high debt/GDP and falling yuan and historically high Chinese stock valuation levels.
YANG is highly volatile and carries substantial risks, which I have discussed above, but it also provides the opportunity for aggressive investors to generate high returns in a Chinese stock bear market.
If you found this recommendation helpful, please let me know in the comments below.
Credit: Source link