

William_Potter
Investment Thesis
Do you agree with me that it would be great to implement an investment portfolio that can help increase your wealth with great confidence, to generate extra income via dividends to cover your monthly expenses, and at the same time, provide you with an additional source of income for your retirement? The Dividend Income Accelerator Portfolio has been built to help you achieve all of these goals.
In today’s article, I will conduct a portfolio analysis about the current composition of The Dividend Income Accelerator Portfolio, which I started building at the start of September.
I see this dividend portfolio as being very well positioned to simultaneously pursue multiple objectives such as achieving a balanced mix of dividend income and dividend growth, aiming for an attractive Total Return and ensuring a reduced level of risk.
The portfolio’s reduced risk level is proven since it is extensively diversified across sectors and industries: no individual position accounts for more than 7% of the overall portfolio. Additionally, no industry accounts for more than 7% of the overall portfolio (besides the ETF Industry), further underlying the portfolio’s broad diversification and reduced level of risk.
The largest position of the portfolio is currently Schwab U.S. Dividend Equity ETF (SCHD), which makes up 61.52% of the overall investment portfolio. It provides investors with both dividend income and dividend growth. Moreover, the ETF helps us to limit the portfolio’s downside risk, since it’s particularly invested in companies that have a low Payout Ratio and are able to pay sustainable dividends.
With a proportion of 6.80%, Apple (AAPL) is currently the largest position of The Dividend Income Accelerator Portfolio. In the analysis below, I explained in detail Apple’s strategic role within The Dividend Income Accelerator Portfolio:
Apple’s Strategic Role Within The Dividend Income Accelerator Portfolio: A Risk/Reward Analysis
Mastercard (MA) is currently the second largest position of The Dividend Income Accelerator Portfolio (6.63%). In the article below I explained the reasons for which I believe that Mastercard is a great risk/reward choice for investors:
Mastercard: One of the World’s best risk/reward Choices for The Dividend Income Accelerator Portfolio
By overweighting companies such as Apple and Mastercard, which come attached to a relatively low risk level and offer the chance of achieving an attractive compound annual rate of return, the portfolio has been optimized in terms of risk and reward.
Currently, The Dividend Income Accelerator Portfolio showcases a Weighted Average Dividend Yield [TTM] of 3.70%, accompanied by a Weighted Average Dividend Growth Rate [CAGR] of 10.73%.
The Dividend Income Accelerator Portfolio
The Dividend Income Accelerator Portfolio’s objective is the generation of income via dividend payments, and to annually raise this sum. In addition to that, its goal is to attain an appealing Total Return when investing with a reduced risk level over the long-term.
The Dividend Income Accelerator Portfolio’s reduced risk level will be reached due to the portfolio’s broad diversification over sectors and industries and the inclusion of companies with a low Beta Factor.
Below you can find the characteristics of The Dividend Income Accelerator Portfolio:
- Attractive Weighted Average Dividend Yield [TTM]
- Attractive Weighted Average Dividend Growth Rate [CAGR] 5 Year
- Relatively low Volatility
- Relatively low Risk-Level
- Attractive expected reward in the form of the expected compound annual rate of return
- Diversification over asset classes
- Diversification over sectors
- Diversification over industries
- Diversification over countries
- Buy-and-Hold suitability
The Selected Picks of The Dividend Income Accelerator Portfolio
|
Symbol |
Company Name |
Sector |
Industry |
Country |
Dividend Yield [TTM] |
Dividend Growth 5Y |
Number of shares |
Acquisition Price per Share in $ |
Current Allocation |
|
SCHD |
Schwab U.S. Dividend Equity ETF |
ETFs |
ETFs |
United States |
3.53% |
13.92% |
13.3761 |
74.83 |
61.52% |
|
O |
Realty Income (O) |
Real Estate |
Retail REITs |
United States |
5.46% |
4.28% |
1.8185 |
55.54 |
5.93% |
|
PM |
Philip Morris (PM) |
Consumer Staples |
Tobacco |
United States |
5.38% |
3.15% |
1.0552 |
95.71 |
6.45% |
|
RY |
Royal Bank of Canada (RY) |
Financials |
Diversified Banks |
Canada |
4.49% |
6.24% |
1.0936 |
92.36 |
6.05% |
|
AAPL |
Apple |
Information Technology |
Technology Hardware, Storage and Peripherals |
United States |
0.56% |
6.59% |
0.5867 |
172.14 |
6.80% |
|
T |
AT&T (T) |
Communication Services |
Integrated Telecommunication Services |
United States |
7.40% |
-5.97% |
6.8036 |
14.84 |
6.61% |
|
MA |
Mastercard |
Financials |
Transaction & Payment Processing Services |
United States |
0.58% |
17.92% |
0.2544 |
396.96 |
6.63% |
|
100.00% |
Source: The Author, data from Seeking Alpha
The Dividend Income Accelerator Portfolio Allocation per ETF/Company
The Schwab U.S. Dividend Equity ETF is currently the largest position of The Dividend Income Accelerator Portfolio. A total of 61.52% of the overall portfolio has been allocated to this ETF. Due to this allocation, our portfolio has already achieved a broad diversification as well as an attractive mix of dividend income and dividend growth. I am further convinced that this ETF will help us to achieve an attractive Total Return when investing over the long term.
With a percentage of 6.80% of the overall portfolio, Apple is the largest individual position of the investment portfolio. The second largest position is Mastercard (with a proportion of 6.63%), followed by AT&T (6.61%), Philip Morris (6.45%), Royal Bank of Canada (6.05%), and Realty Income (5.93%).
Source: The Author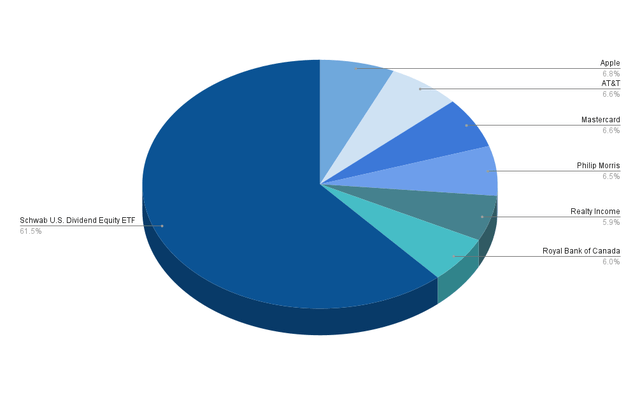
Proof of the portfolio’s broad diversification is evident in the fact that no single company constitutes more than 7% of the overall portfolio, indicating a reduced risk level.
Continuously ensuring a reduced risk level for our portfolio is important because it helps us increase the probability of achieving attractive investment results over the long term.
The Dividend Income Accelerator Portfolio Allocation per Company when allocating SCHD to the Companies it is actually invested in
The table below illustrates the current 10 largest positions of The Dividend Income Accelerator Portfolio when allocating SCHD to the companies it is actually invested in.
|
Position |
Company |
Current Allocation |
Type of Investment |
|
1 |
Apple |
6.80% |
Direct Investment |
|
2 |
Mastercard |
6.63% |
Direct Investment |
|
3 |
AT&T |
6.31% |
Direct Investment |
|
4 |
Philip Morris |
6.45% |
Direct Investment |
|
5 |
Royal Bank of Canada |
6.05% |
Direct Investment |
|
6 |
Realty Income |
5.93% |
Direct Investment |
|
7 |
Broadcom |
2.78% |
Investment via SCHD |
|
8 |
AbbVie |
2.61% |
Investment via SCHD |
|
9 |
Chevron |
2.55% |
Investment via SCHD |
|
10 |
Merck & Co |
2.50% |
Investment via SCHD |
Source: Interactive Brokers, Charles Schwab Asset Management
The current composition of The Dividend Income Accelerator Portfolio further underscores that the portfolio provides investors with a broad diversification. This is the case as no individual position that is already part of SCHD has been added to the portfolio so far, thus ensuring a reduction in concentration risks.
The Dividend Income Accelerator Portfolio’s Allocation per Sector
The graphic below illustrates the current composition of The Dividend Income Accelerator Portfolio when allocating SCHD to the ETF Sector.
Besides the ETF Sector (which has a proportion of 61.52% of the overall portfolio), the Financials Sector accounts for the highest proportion of The Dividend Income Accelerator Portfolio (12.68%). The Financials Sector is represented by Mastercard (6.63% of the overall portfolio) and Royal Bank of Canada (6.05%).
The third largest sector is the Information Technology Sector with 6.80% (represented by Apple), followed by the Communication Services Sector with 6.61% (represented by AT&T), the Consumer Staples Sector with 6.45% (Philip Morris), and the Real Estate Sector with 5.93% (Realty Income).
The portfolio’s extensive diversification over Sectors is underscored by the fact that no Sector besides the ETF Sector accounts for more than 13% of the overall investment portfolio.
Source: The Author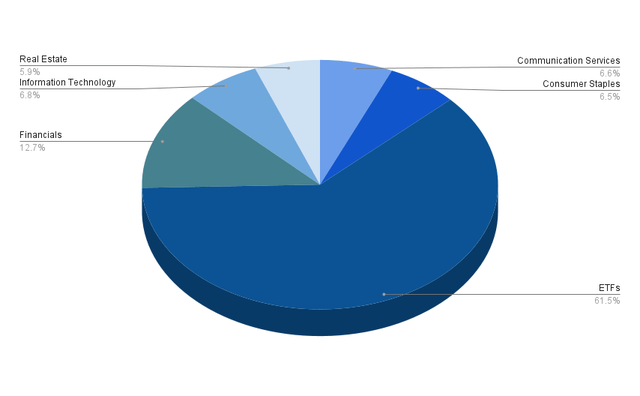
The Dividend Income Accelerator Portfolio’s Allocation per Industry
The graphic below illustrates the composition of The Dividend Income Accelerator Portfolio when allocating SCHD to the ETF Industry.
Besides the ETF Industry (with 61.52%), the largest proportion of The Dividend Income Accelerator Portfolio is currently invested in the Technology Hardware, Storage and Peripherals Industry (with Apple accounting for 6.80%), followed by the Transaction & Payment Processing Services Industry (with Mastercard representing 6.63%), the Integrated Telecommunication Services Industry (AT&T with 6.61%), the Tobacco Industry (Philip Morris with 6.45%), the Diversified Banks Industry (Royal Bank of Canada with 6.05%), and the Retail REITs Industry (Realty Income with 5.93%).
Source: The Author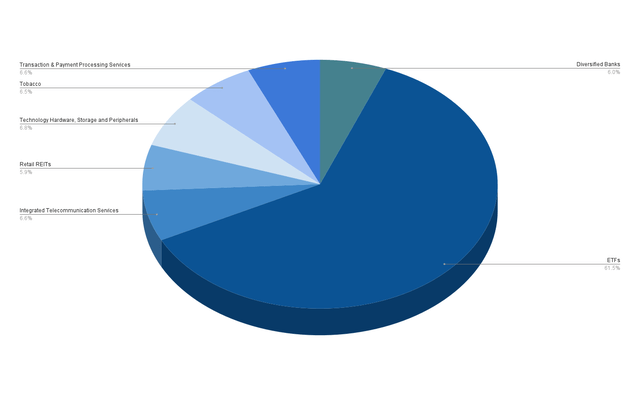
Aside from the ETF Industry, no single industry represents more than 7% of the portfolio, highlighting its broad diversification and reduced risk.
The Dividend Income Accelerator Portfolio’s Geographical Diversification
The largest proportion of The Dividend Income Accelerator Portfolio is currently allocated to companies from the United States (94%). Meanwhile, 6% of the portfolio is allocated to a company outside of the United States (with Royal Bank of Canada representing Canada). This indicates that we have achieved some geographical diversification.
Source: The Author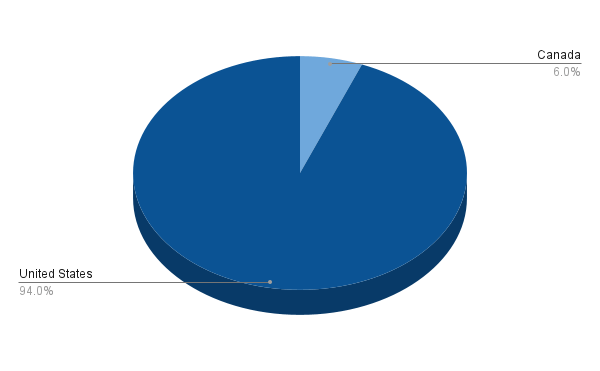
Within the next months, additional companies from outside the United States will be added to the portfolio to increase its geographical diversification. Nevertheless, the objective is to invest the largest part of the portfolio in companies from the United States.
The Projected Dividends for The Dividend Income Accelerator Portfolio
Below you can find an overview of the dividend payments of each of the selected picks that are part of this investment portfolio. Currently, the portfolio’s annual dividend income stands at $59.16.
|
Oct 23 |
Nov 23 |
Dec 23 |
Jan 24 |
Feb 24 |
Mar 24 |
Apr 24 |
May 24 |
Jun 24 |
Jul 24 |
Aug 24 |
Sep 24 |
|
|
Apple |
$0.14 |
$0.14 |
$0.14 |
$0.14 |
||||||||
|
Mastercard |
$0.14 |
$0.14 |
$0.14 |
$0.14 |
||||||||
|
Realty Income |
$0.47 |
$0.47 |
$0.47 |
$0.47 |
$0.47 |
$0.47 |
$0.47 |
$0.47 |
$0.47 |
$0.47 |
$0.47 |
$0.47 |
|
Philip Morris |
$1.37 |
$1.37 |
$1.37 |
$1.37 |
||||||||
|
Royal Bank of Canada |
$1.09 |
$1.09 |
$1.09 |
$1.09 |
||||||||
|
Schwab U.S. Dividend Equity ETF |
$8.75 |
$8.75 |
$8.75 |
$8.75 |
||||||||
|
AT&T |
$1.89 |
$1.89 |
$1.89 |
$1.89 |
||||||||
|
$1.84 |
$3.73 |
$9.22 |
$3.73 |
$1.84 |
$9.22 |
$1.84 |
$3.73 |
$9.22 |
$3.73 |
$1.84 |
$9.22 |
Source: The Dividend Tracker
Through the composition of the portfolio, investors receive dividend payments from at least two different ETFs/companies each month.
Conclusion
The following ETFs and companies have already been incorporated into The Dividend Income Accelerator Portfolio:
- Schwab U.S. Dividend Equity ETF (representing 61.52% of the overall investment portfolio)
- Apple (representing 6.80%)
- Mastercard (6.63%)
- AT&T (6.61%)
- Philip Morris (6.45%)
- Royal Bank of Canada (6.05%)
- Realty Income (5.93%)
The Dividend Income Accelerator Portfolio currently boasts a Weighted Average Dividend Yield [TTM] of 3.70%, in combination with a 5 Year Weighted Average Dividend Growth Rate [CAGR] of 10.73%, blending dividend income with dividend growth while ensuring a reduced risk level.
The portfolio’s broad diversification is evident by the fact that no single position and no industry (besides the ETF Industry) have a proportion of more than 7% of the overall investment portfolio.
Schwab U.S. Dividend Equity ETF accounts for the largest proportion of The Dividend Income Accelerator Portfolio (61.52%). The ETF strongly supports our investment approach to combine dividend income and dividend growth. Furthermore, I am convinced that it will help us to successfully implement the approach of The Dividend Income Accelerator Portfolio.
The Dividend Income Accelerator Portfolio comes attached to plenty of benefits for investors.
The portfolio unifies dividend income and dividend growth and can help you reach an attractive Total Return while investing with a reduced risk level. Through its composition (companies that are most attractive in terms of risk and reward have the highest proportion of the overall portfolio), the portfolio has been optimized in terms of risk/reward.
Whether your aim is to generate extra income via dividends to cover your monthly expenses, or to prepare a portfolio that can help with your retirement, if you want to attain financial freedom or to steadily increase your wealth with confidence: I see The Dividend Income Accelerator Portfolio as an excellent vehicle to achieve these objectives. Do you agree?
Author’s Note: Thank you for reading! I would appreciate hearing your opinion on this portfolio analysis as well as on the current composition of The Dividend Income Accelerator Portfolio. I also appreciate any suggestion of companies that would fit into The Dividend Income Accelerator’s investment approach!
Credit: Source link