

miniseries
Shares of Synchrony Financial (NYSE:SYF) have been falling steadily since July as concerns about rising credit card delinquencies has weighed on investor sentiment. Last September, I rated shares of Synchrony a buy, and since then, the stock has essentially been flat. While this has underperformed my expectations, it has outperformed mid-sized banks, which are down 35% over the past year, based on the S&P Regional Bank ETF (KRE). At this price, I view shares as attractive and would recommend buying.
Seeking Alpha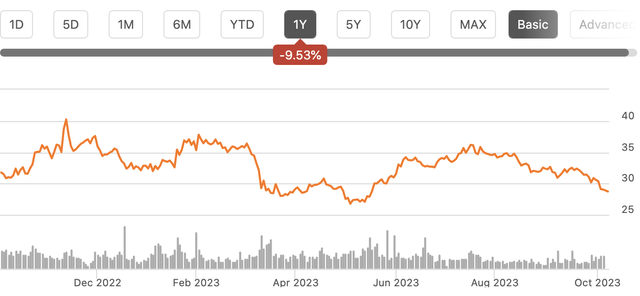
In the company’s second quarter, Synchrony earned $1.32, down from $1.60 last year. This decline is not surprising as credit losses were bound to increase as the economic cycle ages and government stimulus faded away, which is why I had suggested last year to look for earnings to decline but stay above $5.00/share.
As we look through results, this is what occurred. Loan receivables were up $12 billion to $94.8 billion as consumers were carrying more credit card debt. The average balance per account rose 9% to $1,330. Purchase volumes were flat, so consumers are spending similar amounts, just not paying it back as quickly. Higher balances are good in so far as SYF is able to collect interest on more funds, but they become problematic when balances rise to a point where consumers default. Due to increased average balances, management revised its full year receivable growth to 10+% from 8-10% previously.
Indeed, we are starting to see some of this. Synchrony had a 4.75% net charge-off rate, up from 2.73% last year. As a consequence, SYF took $1.4 billion in provisions for credit losses, up from $724 million last year to replenish and build reserves. As you can see below, delinquencies and charge-offs have been rising over the past two years as the cycle ages and the stimulus tailwind dissipates.
Synchrony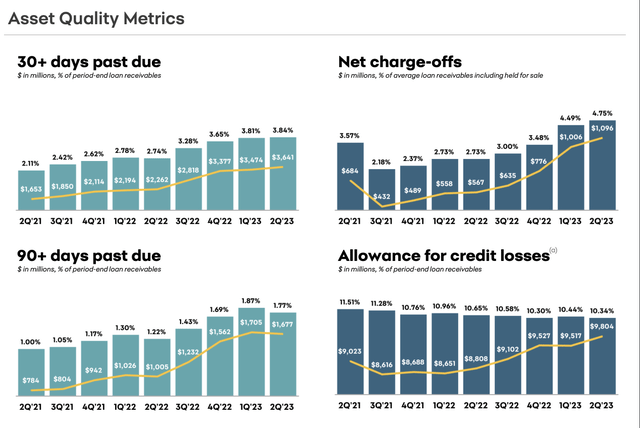
I think it is important to note that the pace of deterioration has improved. For instance, 30+ day delinquencies rose just 3bp in the quarter to 3.84%, the smallest increase of the past year. 90+ day delinquencies fell 10bp to 1.77%, the biggest decline in over 2 years. Alongside quarterly results, management refined guidance and now expects net charges to be in the lower half of the 4.75-5% range.
Credit quality has deteriorated from record strong levels in the wake of COVID, but that deterioration is really back towards normal levels, and now that we are approaching normal, there are signs it may be leveling out. For perspective, I would remind you that at the end of 2019, its 30+ day delinquency rate was 4.4%, and allowances were 6.6%. So delinquencies, are still a little better than back then even after their steady increase-that speaks to just how unsustainably low they had been.
Moreover, SYF had reserved in expectation for a rise in charge-offs, and so reserves as a share of loans have fallen over the past year, but at 10.34%, it is a health level. It is my expectation we see charge-offs stay around current levels, barring a major economic downturn, and reserve growth will be in line with loan growth. While reserves have been a $700 million headwind over the past year the headwind going forward is likely to be much smaller, likely 0-$200 million.
Now, some may fear a much worse outcome from credit card delinquencies, and that the rise continues steadily as it has for two years. I recognize this concern, and much has been made of the fact that nominal credit card debt has risen a lot over the past two years, and it now sits above $1 trillion a record.
St. Louis Federal Reserve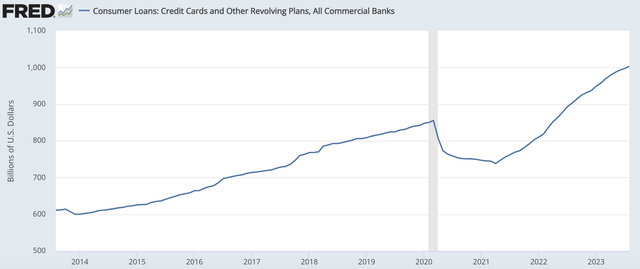
However, it is important to note that nominal wages and the economy have been growing over the past few years. What matters is not how much you owe, but how much you owe relative to what you make. You can carry more debt if you have more income. If we look at credit card debt relative to disposable income, we are sitting back at 2019 levels, again a period when the economy was solid and few feared recession. It has taken a few years, but we have returned to a “normal” state of borrowing, which is why we now see charge-offs and delinquencies returning to their normal level. This is why I do not view it as likely that we see ongoing significant deterioration, absent a major economic downturn.
St. Louis Federal Reserve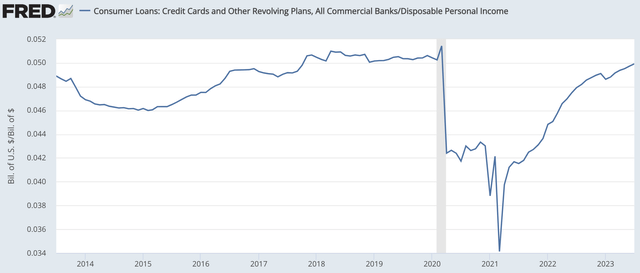
Aside from credit, a major event in the banking sector this year was the funding crisis punctuated by the failure of Silicon Valley Bank. SYF has $75.8 billion in deposits, up $11 billion from last year. It did not see the deposit flight of other banks, in large part because it is primarily an online, retail bank with interest-bearing deposits below FDIC limits. However, it was not immune from increased competition for deposits. In Q2, deposit yields were 3.84%, up 71bp sequentially and 284bp from last year. Loan yields rose just 124bp from last year. Accordingly, net interest margin contracted to 14.9% from 15.6%.
With the scramble for deposits having slowed, and SYF already offering among the highest deposit yields in the market, the headwinds from increased funding costs should largely be in results. Management expects NIM to be in the lower half of the 15-15.25% range, pointing to stabilization around current levels. This is a reasonable forecast. Still, I view the fact SYF was able to grow deposits while other banks lost deposits as a sign of the strength of that franchise.
Even with the headwinds of higher reserves, SYF remains strongly profitable, generating a 21.7% return on tangible equity. As a consequence, it did a $300 million buyback in Q2 with $1 billion authorized for the next year. Since the end of 2016, Synchrony has repurchased 47% of its common stock with share count down 14% over the past year. This strong share count reduction also means that even if net income falls somewhat, EPS can stay steady or even rise.
In addition to solid reserve levels, SYF has a strong capital position with a Common Equity Tier Ratio of 12.3%. Given its excess capital position, on top of its buyback in July, SYF raised its dividend to $0.25 from $0.23.
In my base case, I would expect SYF to maintain the current earnings run-rate of $5.20, but with share count likely to decline by about 6-8% over the next year, that should actually translate to about $5.50 in EPS, giving shares a 5x earnings multiple. If we assume a further $200 million in quarterly credit loss (implying 1/3 the deterioration we have seen the past year), SYF would earn $4 (or $4.20 with a declining share count) for a ~7x multiple. That would be consistent with the economy continuing to slow, potentially a small rise in unemployment, but not an outright recession.
In a recession, allowances could potentially rise by about $500 million/quarter, which would bring earnings down to about $2.50. However, in the recession, we may see the Fed cut rates, reducing its deposit funding costs and alleviating some pressure on NIM, as a partial offset. Even here, shares are trading for less than 12x earnings, and note that job openings just posted a surprise gain. We are not seeing signs of recession in the labor market. As long as unemployment holds up, I would expect delinquencies to begin to stabilize.
Shares are trading less than 1.2x tangible book value, which for a business that earns over 20% on tangible equity, is very cheap in my view. I would look for shares to trade to 1.5x tangible book as investors see moderation in the pace of credit deterioration or about $36, which is still just 7x earnings. In the meantime, with the stock low, the power of the ongoing buyback is strongly accretive, and investors collect a solid and growing dividend. With shares discounting even a moderate downturn, they offer an attractive risk/reward profile and should be bought.
Credit: Source link