


















• bitcoinBitcoin(BTC)$77,879.000.44%
  • ethereumEthereum(ETH)$2,268.620.99%
  • tetherTether(USDT)$1.000.02%
  • binancecoinBNB(BNB)$713.091.20%
  • rippleXRP(XRP)$1.250.45%
  • usd-coinUSDC(USDC)$1.000.01%
  • solanaSolana(SOL)$95.25-0.57%
  • tronTRON(TRX)$0.310537-2.99%
  • Figure HelocFigure Heloc(FIGR_HELOC)$1.063.50%
  • zcashZcash(ZEC)$1,241.21-3.05%
  • HyperliquidHyperliquid(HYPE)$87.790.34%
  • dogecoinDogecoin(DOGE)$0.0757250.70%
  • moneroMonero(XMR)$605.151.68%
  • USDSUSDS(USDS)$1.00-0.01%
  • chainlinkChainlink(LINK)$11.721.89%
  • whitebitWhiteBIT Coin(WBT)$74.830.61%
  • leo-tokenLEO Token(LEO)$9.390.05%
  • cardanoCardano(ADA)$0.1932870.51%
  • stellarStellar(XLM)$0.168558-0.23%
  • nearNEAR Protocol(NEAR)$4.381.00%
  • bitcoin-cashBitcoin Cash(BCH)$282.75-2.75%
  • daiDai(DAI)$1.000.01%
  • Ethena USDeEthena USDe(USDE)$1.000.03%
  • uniswapUniswap(UNI)$7.213.85%
  • litecoinLitecoin(LTC)$56.002.10%
  • RainRain(RAIN)$0.005906-3.88%
  • avalanche-2Avalanche(AVAX)$8.783.95%
  • CantonCanton(CC)$0.0973811.42%
  • USD1USD1(USD1)$1.000.00%
  • suiSui(SUI)$0.900.85%
  • the-open-networkGram (prev. Toncoin)(GRAM)$1.233.67%
  • hedera-hashgraphHedera(HBAR)$0.071716-0.73%
  • tether-goldTether Gold(XAUT)$3,871.79-0.09%
  • Global DollarGlobal Dollar(USDG)$1.000.02%
  • quant-networkQuant(QNT)$200.402.03%
  • paypal-usdPayPal USD(PYUSD)$1.00-0.03%
  • shiba-inuShiba Inu(SHIB)$0.000005-0.17%
  • BittensorBittensor(TAO)$235.980.29%
  • crypto-com-chainCronos(CRO)$0.0515480.24%
  • EthenaEthena(ENA)$0.186728-2.35%
  • Ripple USDRipple USD(RLUSD)$1.000.05%
  • Ondo US Dollar YieldOndo US Dollar Yield(USDY)$1.150.05%
  • Circle USYCCircle USYC(USYC)$1.140.00%
  • okbOKB(OKB)$111.120.36%
  • aaveAave(AAVE)$137.463.02%
  • pepePepe(PEPE)$0.000005-3.00%
  • BlackRock USD Institutional Digital Liquidity FundBlackRock USD Institutional Digital Liquidity Fund(BUIDL)$1.000.00%
  • OndoOndo(ONDO)$0.4108110.80%
  • Pump.funPump.fun(PUMP)$0.0042492.86%
  • MemeCoreMemeCore(M)$0.85-10.36%
TradePoint.io
  • Main
  • AI & Technology
  • Stock Charts
  • Market & News
  • Business
  • Finance Tips
  • Trade Tube
  • Blog
  • Shop
No Result
View All Result
TradePoint.io
No Result
View All Result

Gold Held Up Extremely Well In September Against Rising Real Rates

October 4, 2023
in Market & News
Reading Time: 5 mins read
A A
Gold Held Up Extremely Well In September Against Rising Real Rates
ShareShareShareShareShare

brightstars

YOU MAY ALSO LIKE

U.S. bombers scrambled out of U.K. airbase after threats

U.S. Marine arrested on suspicion of killing Japanese woman in Okinawa

Despite the gold price declining for several months, its performance is extremely strong considering sharply rising real interest rates. To measure gold’s performance against real rates (TIPS yield), I’m introducing the “Gold Price-TIPS Model Tracker” to improve our understanding of how the gold price is set and its future potential.

Introduction

As we have discussed repeatedly on these pages, the gold price has been set by Western institutional money for nearly a century, and from 2006 through February 2022, there was a tight inverse correlation between the price of gold and the yield of 10-year Treasury Inflation Protected Securities (TIPS), which reflect real interest rates.

Then, early 2022, things started to change.
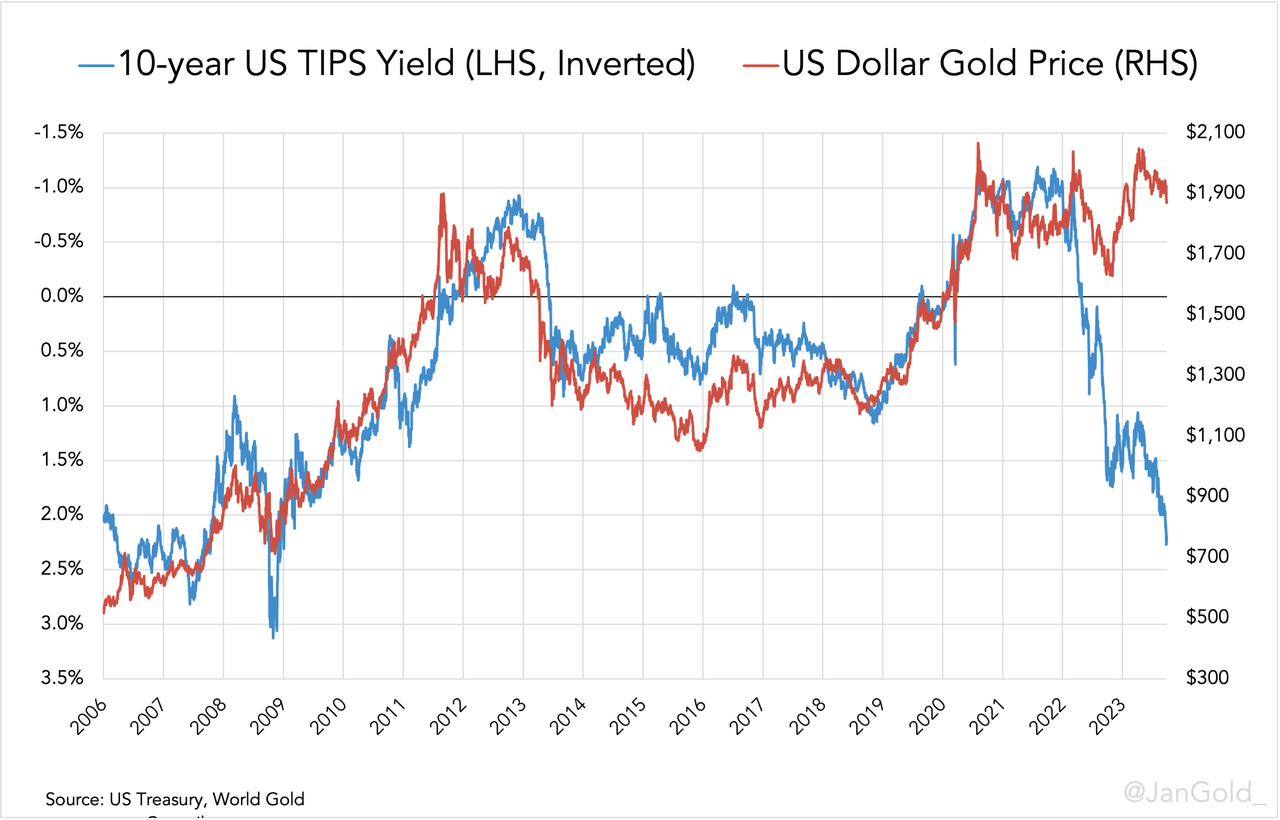
chart of the TIPS yield over the long term

Chart 1. Note the TIPS yield axis is inverted.
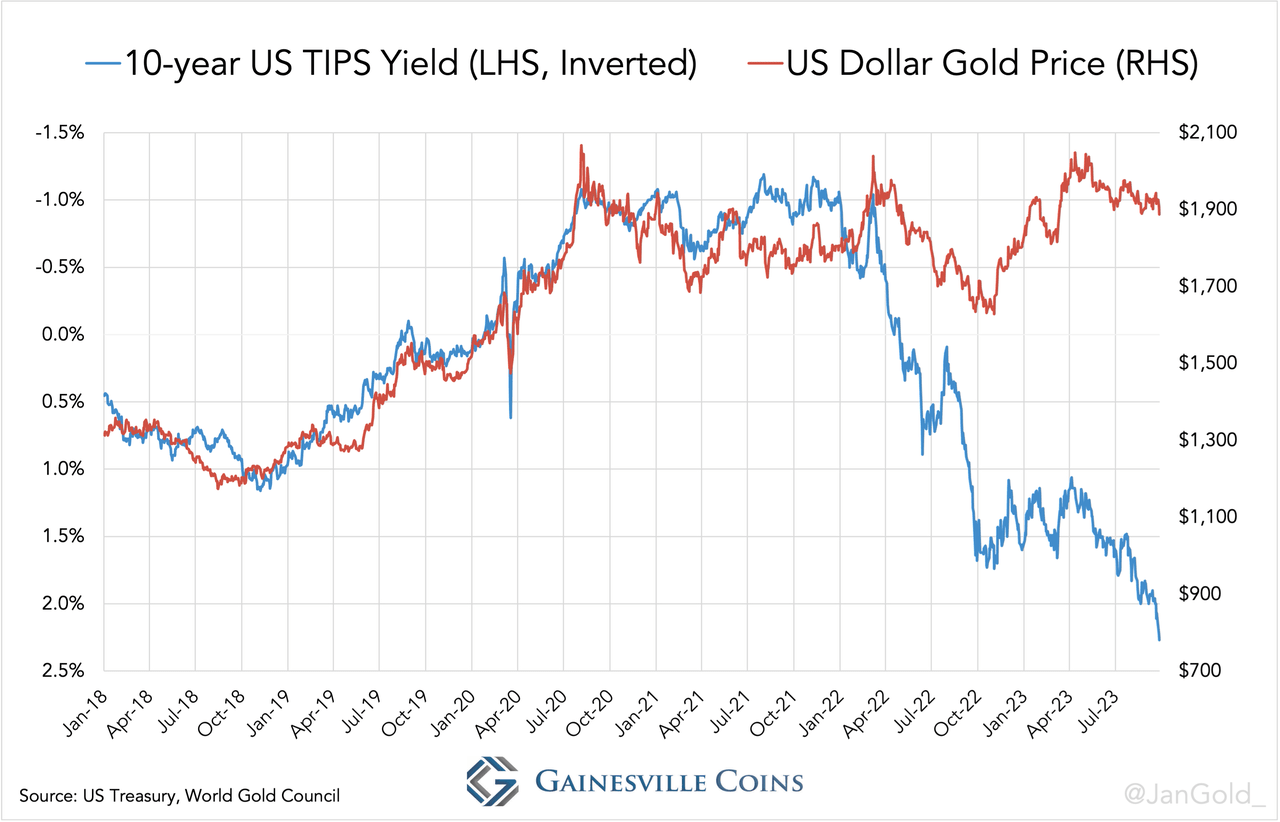
chart of the TIPS yield over the short term

Chart 2.

The Gold Market in Motion

At the outset of the Ukraine war in early 2022, when the West froze Russia’s dollar assets, the gold price started drifting higher than the price previously suggested by the “TIPS model.” Dollar assets had become more risky – next to the fact the TIPS model wasn’t sustainable to begin with – pulling investors into gold.

Initially, I was cautious to say the change in how gold was priced was permanent. After a few months, though, in November 2022, I wrote gold was in a transition phase. War, inflation, and insolvency risk had changed the market’s perception of how gold should be priced. To the upside, that is.

In July, I reiterated gold was showing momentous strength against real rates.

Additionally, in August, I demonstrated that the West was losing control over the price of gold. For ninety years, the gold price was set in wholesale markets such as London and Switzerland, but the East started to overrule the West in late 2022 and early 2023.

The Gold Price-TIPS Model Tracker

To get a better grip on gold’s fate going forward, I created the Gold Price-TIPS Model Tracker that shows gold’s strength or weakness versus the TIPS model on a monthly basis. In the future, we will add the Tracker to other parameters, like global cross-border trade statistics, to get a clearer view on what’s happening in the market and where it’s heading.

The purpose of the Tracker is to learn how the gold price is performing against the price suggested by the TIPS model that ruled from 2006 until 2021. By measuring the difference between the actual gold price and the price suggested by the TIPS model, we can compute the total premium and the monthly increase or decrease of the total premium. The Tracker does not tell us if the price went up or down, but if it went up or down versus the TIPS model.

According to my calculations, the suggested gold price by the TIPS model at the end of September 2023 was $779 per troy ounce, while in reality an ounce changed hands for $1,871 (see chart 2). Consequently, by September, the total premium had reached 140%.

Last month alone, in September, the Tracker indicates a whopping 32% was added to the total premium, a sign of extraordinary strength of the gold price relative to real rates.

chart showing the Gold vs TIPS Model Tracker

Chart 3.

Conclusion

All of the above seems bullish for gold, as the trend of the total premium is up. Apparently, the market has altered its view and prices gold higher against real rates. A few observations to consider, though.

The Tracker doesn’t have a very long track record, and the total premium started accelerating at the start of a hiking cycle by the Federal Reserve in early 2022. Ever since, the total premium has been growing while real rates have been rising. Currently, we don’t know for sure how the Tracker will perform when rates fall.

What we do know is that in the few months since February 2022, that rates went down, the Tracker showed weakness – the total premium declined (see chart 4 below). If rates fall, there is less gold buying strength as some investors still apply the old model.
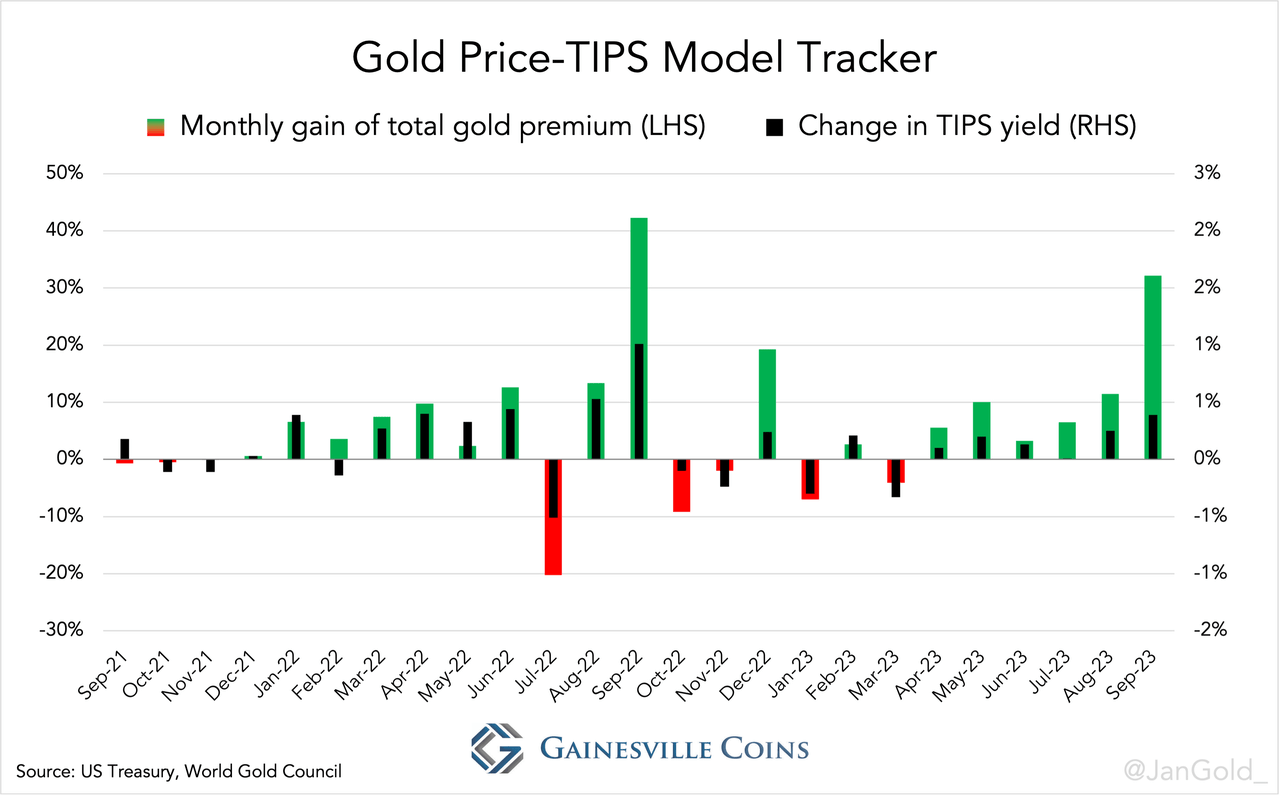
chart showing the Tracker vs TIPS yield change

Chart 4. When the TIPS yield falls, the Tracker goes down.

Up until now, the Tracker has only shown strength when rates rise and the West sells gold that the East, mainly the Chinese central bank, is buying aggressively.

It’s hard to say how the Tracker reacts when rates truly reverse. For sure, the gold price will rise from a higher base on falling rates, but it’s hard to say at this stage if the total premium will decline or increase in such a scenario.

Original Post

Editor’s Note: The summary bullets for this article were chosen by Seeking Alpha editors.

Credit: Source link

ShareTweetSendSharePin

Related Posts

U.S. bombers scrambled out of U.K. airbase after threats
Market & News

U.S. bombers scrambled out of U.K. airbase after threats

November 1, 2026
U.S. Marine arrested on suspicion of killing Japanese woman in Okinawa
Market & News

U.S. Marine arrested on suspicion of killing Japanese woman in Okinawa

November 1, 2026
Cornell University police made drug arrest hours before alleged sexual assault
Market & News

Cornell University police made drug arrest hours before alleged sexual assault

November 1, 2026
Early indications suggest Flydubai co-pilot acted alone in attack, officials say
Market & News

Early indications suggest Flydubai co-pilot acted alone in attack, officials say

November 1, 2026
Next Post
Will Unicorns Go Bust in 2017?

Will Unicorns Go Bust in 2017?

Leave a Reply Cancel reply

Your email address will not be published. Required fields are marked *

Search

No Result
View All Result
Cemex: Incremental Progress Is Real, But The Market Wants More (NYSE:CX)

Cemex: Incremental Progress Is Real, But The Market Wants More (NYSE:CX)

October 27, 2026
Fed meeting live updates: No hike expected, but investors watching Warsh for what's next – CNBC

Fed meeting live updates: No hike expected, but investors watching Warsh for what's next – CNBC

October 28, 2026
Drive to Decision Day: Voters sound off on the economy, war and Washington

Drive to Decision Day: Voters sound off on the economy, war and Washington

October 29, 2026

About

Learn more

Our Services

Legal

Privacy Policy

Terms of Use

Bloggers

Learn more

Article Links

Contact

Advertise

Ask us anything

©2020- TradePoint.io - All rights reserved!

Tradepoint.io, being just a publishing and technology platform, is not a registered broker-dealer or investment adviser. So we do not provide investment advice. Rather, brokerage services are provided to clients of Tradepoint.io by independent SEC-registered broker-dealers and members of FINRA/SIPC. Every form of investing carries some risk and past performance is not a guarantee of future results. “Tradepoint.io“, “Instant Investing” and “My Trading Tools” are registered trademarks of Apperbuild, LLC.

This website is operated by Apperbuild, LLC. We have no link to any brokerage firm and we do not provide investment advice. Every information and resource we provide is solely for the education of our readers. © 2020 Apperbuild, LLC. All rights reserved.

No Result
View All Result
  • Main
  • AI & Technology
  • Stock Charts
  • Market & News
  • Business
  • Finance Tips
  • Trade Tube
  • Blog
  • Shop

© 2023 - TradePoint.io - All Rights Reserved!