

malerapaso
The Invesco Dividend Achievers™ ETF (NASDAQ:PFM) might look like a solid investment vehicle to consider for investors who are on the lookout for a portfolio of established dividend growth stories with substantial depth and breadth of exposure. However, this obviously does not mean the fund is ideal for any market environment. In essence, it has a few notable nuances that make it worth avoiding at this juncture.
The previous time I covered PFM was in July 2022, when I opted for a neutral stance. Since the note, about 6.7% of the portfolio has been replaced, predominantly in the wake of the annual reconstitution of its underlying index. Also, PFM has significantly underperformed the S&P 500 index, principally because it failed to keep pace with the market amid the growth rotation earlier this year.
Seeking Alpha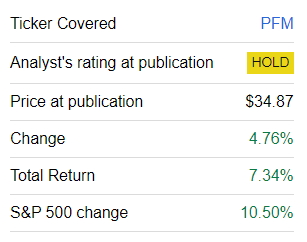
Before we delve into the intricacies of the current iteration of the fund’s portfolio, I should clarify that there will be no rating upgrade today as I remain skeptical about PFM’s strategy that makes the basket top-heavy (27.5% of the net assets are allocated to just ten key companies) and subsequently exposed to the valuation issue.
Besides, I would like to borrow the structure from the previous article and frame today’s note in a similar fashion, paying attention to the three key parameters impacting the rating: its valuation, quality exposure, and dividend credentials.
Strategy Recap: Focusing On Dividend Growth Stories
According to the Invesco website, PFM’s strategy is based on the NASDAQ US Broad Dividend Achievers™ Index, which is “reconstituted annually in March and rebalanced quarterly in March, June, September and December.” The fund gave the following definition of a dividend achiever:
These companies have increased their annual dividend for 10 or more consecutive fiscal years.
More details on the selection and weighting process are available in the index methodology document.
Factor #1: Valuation
At this juncture, I believe investors should rotate towards value as interest rate uncertainty continues to weigh on growth premia, thus painting a rather gloomy picture for growth style. PFM technically belongs to the Large Value ETF sub-class, which, however, does not immediately imply its valuation is attractive enough for the current environment. Truly, the fund might look a bit cheaper compared to the iShares Core S&P 500 ETF (IVV) on an earnings yield basis (5.2% vs. 4.7%). For more context, as my analysis illustrated, the primary reason for the yield being relatively attractive is the financial sector that has contributed solidly to this figure, as, for example, among 26 companies with an EY above 15%, 17 are financials. This is, however, just the tip of the iceberg. The table below is supposed to contextualize this issue.
| Metric | 27-Sep |
| Market Cap | $364.49 billion |
| EY | 5.16% |
| P/S | 4.39 |
| EPS Fwd | 7.52% |
| Revenue Fwd | 6.38% |
| ROE | 76.28% |
| ROA | 10.34% |
| 3Y Div CAGR | 8.5% |
| 5Y Div CAGR | 9.5% |
| DY Fwd | 2.5% |
| Quant Valuation B- or higher | 9.50% |
| Quant Profitability B- or higher | 94% |
Calculated by the author using data from Seeking Alpha and the fund; financial data as of September 28, holdings as of September 27
As it can be seen, the PFM portfolio is rather heavy in mega caps (including the most expensive companies in the world from the trillion league like Apple (AAPL) and Microsoft (MSFT)), so small wonder that just 9.5% of its portfolio is comparatively underpriced (as shown by their Quant ratings). This is obviously too small. At the same time, a 5.2% EY, which comes with only mid-single-digit revenue and EPS forward growth rates, is not an alluring proposition.
Factor #2: Quality
On the quality front, there is a lot to appreciate, both in terms of margins and capital efficiency. First, the share of stocks that underdeliver on profitability (a D+ Quant Profitability grade or worse) is diminutive, around 3.3%. As I have already clarified in the previous note, this is the direct consequence of the fund being overweight in large caps. Next, only 1.1% of the holdings failed to deliver GAAP net income in the last twelve months. Its weighted-average Return on Assets is solid at over 10%. For context, this is more than 2x higher compared to the ROA of the ProShares Russell 2000 Dividend Growers ETF (SMDV), which I covered in September; the primary reason is that PFM favors larger companies, while SMDV is into mostly mid caps that tend to have quality issues. Next, a ROE metric above 76% also looks outstanding, though the issue here is that the figure is less reliable than the ROA as it was skewed by debt-heavy The Home Depot (HD) and Cogent Communications Holdings (CCOI); both have a four-digit ROE. As a reminder, when borrowings go notably higher, shareholder equity declines, thus artificially boosting ROE.
Factor #3: Dividend Credentials
Since PFM has a methodology I would call value-agnostic, it has never been a generous dividend payer; for example, its DY only slightly surpassed the 3% landmark during the coronavirus sell-off of March 2020 and then inched solidly lower during the recovery. At the moment, the ETF is yielding around 1.97%, while the portfolio’s weighted-average LTM DY is 2.4% (the forward one is at 2.5%, as per my calculations). In fairness, this level is hardly appealing, especially considering the 10-year Treasury yield is at 4.58% as of writing this article.
Though not delivering much on the yield front, the fund remains heavy in high-quality dividend stories, which I discussed in the July 2022 note. To corroborate, over 87% of its net assets are allocated to companies with a B- Dividend Safety grade or better, while almost 93% have a similar Consistency grade.
There is something interesting regarding dividend growth as well, with the portfolio having 8.5% 3-year and 9.5% 5-year DPS compound annual growth rates. For context, SMDV had ~7% and 7.75% as of the previous article, respectively. Alas, this alone cannot make PFM a Buy, as value is much more important currently.
Investor Takeaway
PFM is a nicely diversified dividend ETF, with a strategy based on an index requiring a 10-year dividend growth story as the bare minimum to qualify. In the current version, PFM has a portfolio of 404 common stocks, REITs, and limited partnership interests.
It is worth noting that the fund’s past performance is mixed. For example, during the March 2015 – September 2023 period (shortened intentionally as REGL and SMDV were incepted in February 2015), PFM underperformed the ProShares S&P 500 Dividend Aristocrats ETF (NOBL), with an only 8.48% annualized return delivered. It failed to keep pace with IVV as well. However, it did beat the ProShares S&P MidCap 400 Dividend Aristocrats ETF (REGL) and SMDV.
| Portfolio | IVV | PFM | NOBL | REGL | SMDV |
| Initial Balance | $10,000 | $10,000 | $10,000 | $10,000 | $10,000 |
| Final Balance | $23,862 | $20,113 | $20,636 | $19,629 | $16,712 |
| CAGR | 10.66% | 8.48% | 8.81% | 8.17% | 6.17% |
| Stdev | 15.70% | 13.75% | 15.07% | 15.20% | 15.51% |
| Best Year | 31.25% | 26.88% | 26.94% | 28.64% | 32.51% |
| Worst Year | -18.16% | -6.23% | -6.51% | -5.19% | -6.05% |
| Max. Drawdown | -23.93% | -19.08% | -23.23% | -24.53% | -24.71% |
| Sharpe Ratio | 0.64 | 0.57 | 0.55 | 0.51 | 0.38 |
| Sortino Ratio | 0.98 | 0.87 | 0.84 | 0.77 | 0.57 |
| Market Correlation | 1 | 0.94 | 0.93 | 0.89 | 0.8 |
Created using data from Portfolio Visualizer
To conclude, PFM has a portfolio with remarkable dividend consistency and safety credentials, but it notably lags on value. I believe this is a suboptimal proposition in the current market environment that is worth avoiding.
Credit: Source link