
• bitcoinBitcoin(BTC)$79,112.00-1.02%
  • ethereumEthereum(ETH)$2,487.47-0.44%
  • tetherTether(USDT)$1.000.00%
  • binancecoinBNB(BNB)$738.94-1.37%
  • rippleXRP(XRP)$1.40-1.29%
  • usd-coinUSDC(USDC)$1.000.00%
  • solanaSolana(SOL)$103.75-2.47%
  • tronTRON(TRX)$0.334556-0.22%
  • Figure HelocFigure Heloc(FIGR_HELOC)$1.060.00%
  • zcashZcash(ZEC)$1,158.50-6.14%
  • HyperliquidHyperliquid(HYPE)$85.07-3.43%
  • dogecoinDogecoin(DOGE)$0.0897990.30%
  • RainRain(RAIN)$0.016303-3.20%
  • USDSUSDS(USDS)$1.00-0.01%
  • moneroMonero(XMR)$517.76-2.43%
  • chainlinkChainlink(LINK)$12.732.53%
  • whitebitWhiteBIT Coin(WBT)$72.90-0.97%
  • leo-tokenLEO Token(LEO)$9.20-1.38%
  • cardanoCardano(ADA)$0.2194540.02%
  • stellarStellar(XLM)$0.1900363.17%
  • bitcoin-cashBitcoin Cash(BCH)$260.131.32%
  • daiDai(DAI)$1.00-0.01%
  • Ethena USDeEthena USDe(USDE)$1.00-0.01%
  • litecoinLitecoin(LTC)$55.111.24%
  • uniswapUniswap(UNI)$6.84-4.29%
  • USD1USD1(USD1)$1.000.01%
  • CantonCanton(CC)$0.105696-3.61%
  • the-open-networkGram (prev. Toncoin)(GRAM)$1.40-1.70%
  • hedera-hashgraphHedera(HBAR)$0.0820751.89%
  • avalanche-2Avalanche(AVAX)$8.075.56%
  • suiSui(SUI)$0.823.39%
  • Global DollarGlobal Dollar(USDG)$1.000.02%
  • shiba-inuShiba Inu(SHIB)$0.000005-0.05%
  • nearNEAR Protocol(NEAR)$2.30-4.66%
  • paypal-usdPayPal USD(PYUSD)$1.000.00%
  • BlackRock USD Institutional Digital Liquidity FundBlackRock USD Institutional Digital Liquidity Fund(BUIDL)$1.000.00%
  • crypto-com-chainCronos(CRO)$0.057019-0.96%
  • tether-goldTether Gold(XAUT)$4,408.86-0.18%
  • Circle USYCCircle USYC(USYC)$1.140.00%
  • MemeCoreMemeCore(M)$1.130.63%
  • BittensorBittensor(TAO)$259.330.30%
  • Ripple USDRipple USD(RLUSD)$1.000.01%
  • okbOKB(OKB)$114.881.29%
  • Ondo US Dollar YieldOndo US Dollar Yield(USDY)$1.150.03%
  • AsterAster(ASTER)$0.77-0.19%
  • mantleMantle(MNT)$0.623.21%
  • aaveAave(AAVE)$131.68-1.49%
  • pax-goldPAX Gold(PAXG)$4,410.02-0.25%
  • OndoOndo(ONDO)$0.3853441.88%
  • polkadotPolkadot(DOT)$1.1013.99%
TradePoint.io
  • Main
  • AI & Technology
  • Stock Charts
  • Market & News
  • Business
  • Finance Tips
  • Trade Tube
  • Blog
  • Shop
No Result
View All Result
TradePoint.io
No Result
View All Result

S&P 500 Earnings Yield Hits Highest Level Since Mid-May ’23

September 29, 2023
in Market & News
Reading Time: 4 mins read
A A
S&P 500 Earnings Yield Hits Highest Level Since Mid-May ’23
ShareShareShareShareShare

Ralf Hahn

YOU MAY ALSO LIKE

Videos show man firing AR-15 at Las Vegas homes

Tropical Storm Bertha threatens Southeast U.S.

In late July ’23, the S&P 500 earnings yield was scraping 5% as noted within this earnings update from July 28th ’23. Today, the last trading day of September ’23 and the 3rd quarter, and given the tough August and September, the S&P 500 earnings yield has jumped to 5.43%, a level not seen since mid-May ’23.

The S&P 500 earnings yield is not a perfect market timing indicator, but does reflect accurately the “fear/greed” aspects of market sentiment.

Excluding the pandemic meltdown of early 2020, the last time the S&P 500 earnings yield hit a real extreme was the last week of 2018, or Christmas week, when it touched 7% on that Q4 ’18, S&P 500 meltdown. Seems like ancient history now, but it helps to know the extremes.

Here’s another interesting data point: The expected 4th quarter ’23 S&P 500 growth rate has jumped to +12.7%, the highest expected growth rate for S&P 500 EPS in calendar 2023 (noted in the black bordered column below).
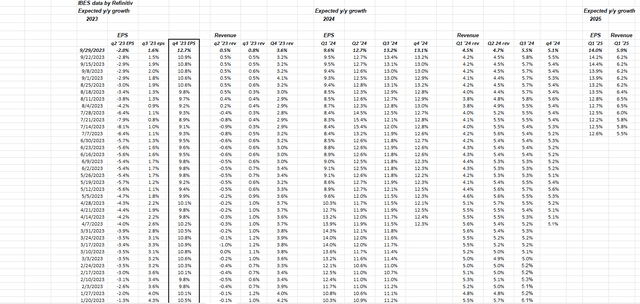
expected S&P 500 growth rate

The reason Q4 ’23 is looking so robust is that Q4 ’22 is when the S&P 500 EPS finally turned negative last year, falling -3.2% for the quarter, a lot of it due to Meta’s (META) profit warning, but 9 of the 11 sectors within the S&P 500 had negative earnings growth in Q4 ’22.

Here’s how the S&P 500 EPS growth by sector looked in Q4 ’22:

  • Communication Services: -28.2%
  • Basic Materials: -20%
  • Consumer Discretionary: -15.6%
  • Technology: -10%
  • Financials: -8.9%
  • Utilities: -4.2%
  • Real Estate: -3%
  • Health Care: -2.7%
  • Consumer Staples: -2.5%
  • Energy: +59%
  • Industrials: +41%

For the S&P 500 as a whole, revenue grew +5.8% in Q4 ’22, while S&P 500 EPS fell 3.2%.

The S&P 500 is facing much easier EPS compares in the next few quarters.

S&P 500 data

  • The forward 4-quarter estimate (FFQE) improved this week to $232.95 from last week’s $232.63. It’s the end of the quarter so earnings revisions are slower now until Q3 ’23 earnings start around October 12th to 13th, but if we look forward to the quarterly “bump” in next week’s FFQE, which is the forward estimate for Q4 ’23 through Q3 ’24, the EPS estimate is $240.16.
  • The P/E ratio on the forward estimate today is 18.4x vs. 18.5x last week.
  • The S&P 500 earnings yield is 5.43%, but using next week’s FFQE, the earnings yield is 5.60%. ($240.16 / 4,288.05).
  • The Q2 ’23 bottom-up estimate ended the quarter at $54.29, after starting the quarter at $52.91.
  • It’s interesting that the Q3 ’23 bottom-up quarterly estimate of $55.92 is actually $0.03 from the June 30 estimate of $55.89.

There has been absolutely no degradation or negative revisions to the Q3 ’23 S&P 500 quarterly bottom-up estimate.

That doesn’t happen that often, and it’s a good sign for S&P 500 earnings.

Summary/conclusion

The plan is to do more writing this weekend on S&P 500 earnings and a couple of other topics. It’s the quiet period for S&P 500 earnings and revisions for the next two weeks, even though Nike (NKE) and FedEx (FDX) were positive surprises and Micron Technology (MU) is probably not as bad as the stock trading implied after it reported its August ’23 quarter.

Nike’s big EPS beat was aided by a lower-than-expected tax rate, thus the quality wasn’t as robust as expected, but the gross margin guidance was a plus.

This blog’s Nike earnings preview noted how negative sentiment and expectations were coming into the quarter. Small quantities of Nike were added today and the plan is to build the position on weakness.

Take everything here with a healthy grain of salt. None of this should be construed as advice or recommendations. Past performance is no guarantee of future results and represents only one person’s opinion.

All S&P 500 EPS and revenue data is sourced from IBES data by Refinitiv, or from FactSet where noted. Capital market can change quickly, both positively and negatively. Use your comfort level with market volatility to adjust your portfolio accordingly.

Thanks for reading.

Original Post

Editor’s Note: The summary bullets for this article were chosen by Seeking Alpha editors.

Credit: Source link

ShareTweetSendSharePin

Related Posts

Videos show man firing AR-15 at Las Vegas homes
Market & News

Videos show man firing AR-15 at Las Vegas homes

September 7, 2026
Tropical Storm Bertha threatens Southeast U.S.
Market & News

Tropical Storm Bertha threatens Southeast U.S.

September 7, 2026
Australian mother welcomes identical quadruplet girls
Market & News

Australian mother welcomes identical quadruplet girls

September 7, 2026
Janus Henderson Global Multi-Asset Capital Preservation Managed Account Q2 2026 Commentary
Market & News

Janus Henderson Global Multi-Asset Capital Preservation Managed Account Q2 2026 Commentary

September 7, 2026
Next Post
GM Loses Nickname – Taxpayers Lose Billions

GM Loses Nickname - Taxpayers Lose Billions

Leave a Reply Cancel reply

Your email address will not be published. Required fields are marked *

Search

No Result
View All Result
You Make 285,000 And Have Nothing To Show For It

You Make 285,000 And Have Nothing To Show For It

September 6, 2026
Concrete Pumping Holdings, Inc. (BBCP) Q3 2026 Earnings Call Transcript

Concrete Pumping Holdings, Inc. (BBCP) Q3 2026 Earnings Call Transcript

September 3, 2026
Two men stabbed near Central Park

Two men stabbed near Central Park

September 6, 2026

About

Learn more

Our Services

Legal

Privacy Policy

Terms of Use

Bloggers

Learn more

Article Links

Contact

Advertise

Ask us anything

©2020- TradePoint.io - All rights reserved!

Tradepoint.io, being just a publishing and technology platform, is not a registered broker-dealer or investment adviser. So we do not provide investment advice. Rather, brokerage services are provided to clients of Tradepoint.io by independent SEC-registered broker-dealers and members of FINRA/SIPC. Every form of investing carries some risk and past performance is not a guarantee of future results. “Tradepoint.io“, “Instant Investing” and “My Trading Tools” are registered trademarks of Apperbuild, LLC.

This website is operated by Apperbuild, LLC. We have no link to any brokerage firm and we do not provide investment advice. Every information and resource we provide is solely for the education of our readers. © 2020 Apperbuild, LLC. All rights reserved.

No Result
View All Result
  • Main
  • AI & Technology
  • Stock Charts
  • Market & News
  • Business
  • Finance Tips
  • Trade Tube
  • Blog
  • Shop

© 2023 - TradePoint.io - All Rights Reserved!