


manassanant pamai
By Gargi Pal Chaudhuri
As broadly expected, the Federal Reserve raised the policy rate by 25 basis points (0.25%) at its May 3 meeting. While the Fed did not commit to a pause, markets are overwhelmingly convinced – barring a dramatic change in the economic data or an exogenous shock – that this latest hike was the last hike of the cycle. From the statement, we now know the Committee no longer sees that “some additional policy firming” is needed. This is not the first time that the market has concluded that the Fed was set to ease and up until this point we have stubbornly argued the notion that the Fed would keep hiking to counter high and persistent inflation. This time, however, we find ourselves broadly in agreement that the time for the pause has finally arrived.
3 Reasons The Fed Is Likely To Pause
Here are three reasons we think this time is different, and the Fed will pause its tightening cycle:
- Recent data suggest growth has slowed and inflation has moderated. While price pressures have not eased enough to justify rate cuts, a pause at current levels no longer seems unreasonable
- Policy rates have finally risen to levels consistent with Federal Reserve guidance. A 25 basis point hike at the May FOMC brings the policy rate range to 5.00-5.25%, squarely in line with the median 2023 “dot plot” in the FOMC’s latest Summary of Economic Projections
- Banking system stress has tightened financial conditions. Tighter bank lending standards can obviate the need for further policy rate hikes
Importantly, a Fed Pause is not the same as a Fed Pivot
A pause is a period where the Fed keeps rates “higher” and monitors the development of the economy and inflation. In the five previous hiking cycles since 1990, the Fed paused an average of 10 months between its last hike and its first cut (Figure 1). Even though this hiking cycle was incredibly fast relative to history, we expect the pause to be more in line with historic averages.
So the policy is tight. And you see that in interest-sensitive activities. And you also begin to see it more and more in other activities. And if you put the – you put the credit tightening on top of that and the QT that’s ongoing, I think you feel like, you know, we’re – we may not be far off. Possibly even at that level.
We’re trying to reach and then stay at a – for an extended period – a level of policy, a policy stance that is sufficiently restrictive to bring inflation down 2% over time… And we thought that this rate hike along with the meaningful change in our policy statement was the right way to balance that.
– Federal Reserve Chair Jerome Powell
What A Fed Pause May Mean For Portfolios
With an attractive money market and ultra-short-term bond yields, investors have been finding shelter in cash and cash alternatives in the past 12 months, especially around the regional bank volatility in March.1 However, as we reach the potential end of the Fed hiking cycle, it’s important to remember that sitting on too much cash, even in an ultra-short duration fund, can be costly; while investors can help avoid large market drawdowns with large cash allocations, investors on the sidelines have the potential to miss market swings to the upside.
Low-risk solutions such as money market funds and short-duration Treasury ETFs can offer potentially attractive income, but historical data shows that cash exposures return less on average than core bond and short-term bond exposures when the Fed stops hiking interest rates2 (Figure 1). On average, between 1990 and February 2023 core bond exposures performed 4% better than cash alternatives when the Fed held or dropped rates. Similarly, investment-grade short-term bonds performed 1.9% better than cash in the same environment.3
Figure 1: Bloomberg US Aggregate vs. cash-alternative total returns after the last rate hike
BlackRock, Bloomberg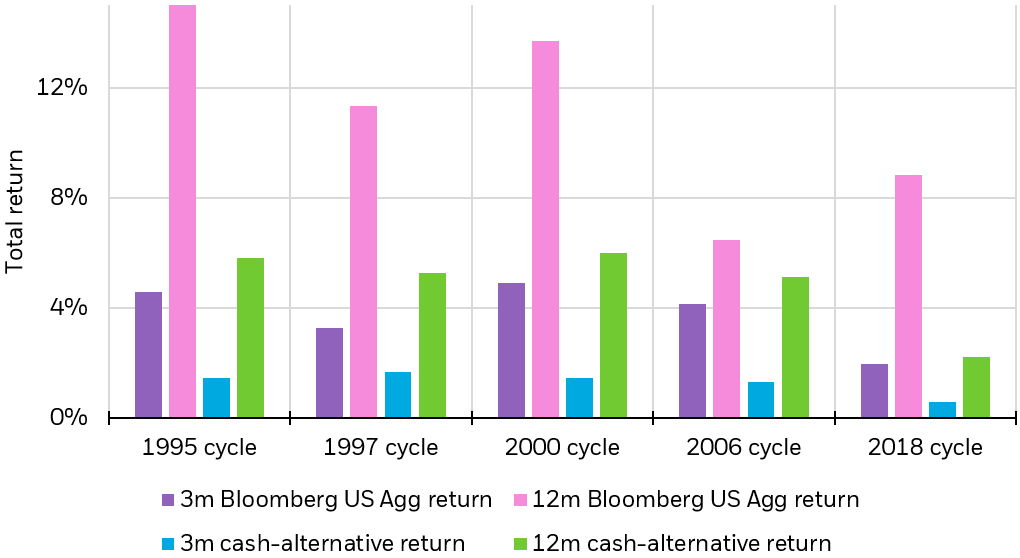
Chart by iShares Investment Strategy. Bloomberg US Agg return as represented by Bloomberg US Aggregate Index, cash-alternative as represented Bloomberg US Treasury Bill 1-3M. Returns rebased to 0 on the day of the last hike for each cycle. ‘3m return’ in reference to 3 months following the last hike, ’12m return’ in reference to 12 months following the last hike. ‘1995 cycle’ in reference to the Fed’s final hike of the 1995 cycle on February 1, 1995, ‘1997 cycle’ in reference to the Fed’s final hike of the 1997 cycle on March 25, 1997, ‘2000 cycle’ in reference to the Fed’s final hike of the 2000 cycle on May 16, 2000, ‘2006 cycle’ in reference to the Fed’s final hike of the 2006 cycle on June 29, 2006, ‘2018 cycle’ in reference to the Fed’s final hike of the 2018 cycle on December 19, 2018. Index performance is for illustrative purposes only. Index performance does not reflect any management fees, transaction costs or expenses. Indexes are unmanaged and one cannot invest directly in an index. Past performance does not guarantee future results.
Chart description: Bar chart depicting the total return (%) for the Bloomberg US Agg and cash alternatives in the past five rate hiking cycles (1995, 1997, 2000, 2006, and 2018). The chart shows 3-month returns and 12-month returns. For each cycle, the Bloomberg US Agg had higher total returns in both timeframes.
As data begins to show slowing activity in the U.S. economy, we also think it’s important to think about where investors might add ballast to their portfolios. We believe investors may want to consider stepping into high-quality medium-term fixed-income – bonds maturing between 3-7 years – through exposure to the broader U.S. bond market. Not only can investors seek ballast, but current Bloomberg US Aggregate Index (AGG) yields also provide a potential cushion where investors can still see positive returns even if bond yields rise, driving bond prices lower. Currently, the yield for U.S. 10-Year Treasuries could rise about 72 basis points (0.72%) before the total return on the Agg turns negative.4
With persistently high inflation pressure, we continue to emphasize quality in stock portfolios, as rates could remain relatively firm during the pause period. Growth companies with a strong quality tilt – characterized by high returns on capital, margin stability, and solid balance sheets with reasonable valuations – have tended to outperform in a late-cycle environment with tight financial conditions.5 Investors may look into both U.S. quality factor and international quality factor exposures to add quality to their portfolios.
Conclusion
Given the positive performance of the equity markets this year, despite slowing earnings growth and the possibility of a recession, we believe markets will remain range bound and the upside from today’s valuations may be limited. Investors can potentially weather the storm by staying allocated to defensive strategies such as minimum volatility. Min vol has historically lowered risk in portfolios. In fact, MSCI USA Minimum Volatility Index has had ~18% less volatility than the S&P 500 Index since inception.6 Investors can use minimum volatility strategies to provide ballast in their portfolios and allow them to stay invested during periods of market turmoil.
Past performance is no guarantee of future results, of course, but historically both domestic equity and fixed-income markets have posted higher returns three months after the Fed’s last rate hike. And alternatively, investors may consider alternative assets like gold. Although gold is a non-yielding asset, a tactical allocation may make sense for some investors in an environment of falling real rates, a weaker dollar, and as a hedge against potential shocks.
1 Source: BlackRock, Bloomberg, as of May 1, 2023. Flow into cash and cash-like alternatives from EPFR.
2 Source: Bloomberg, 1/1/1990 through 2/28/2023. Core bonds defined as Bloomberg US Aggregate Bond Index, investment grade short-term bonds defined as Bloomberg US Aggregate 1-3 Year Index, cash defined as Bloomberg US Treasury Bill 1-3M.
3 Source: Bloomberg, 1/1/1990 through 2/28/2023. Core bonds defined as Bloomberg US Aggregate Bond Index, investment grade short-term bonds defined as Bloomberg US Aggregate 1-3 Year Index, cash defined as Bloomberg US Treasury Bill 1-3M. Indexes are unmanaged and one cannot invest directly in an index. Past performance does not guarantee future results.
4 Source: Bloomberg, as of April 25, 2023. The Agg represented by the Bloomberg US Agg Total Return Value Unhedged USD Index (LBUSTRUU Index).
5 Source: “Demonstrating factor cyclicality” chart.
6 Source: Bloomberg, as of May 5, 2023. MSCI USA Minimum Volatility Index incepted June 02, 2008.
Carefully consider the Funds’ investment objectives, risk factors, and charges and expenses before investing. This and other information can be found in the Funds’ prospectuses or, if available, the summary prospectuses, which may be obtained by visiting the iShares Fund and BlackRock Fund prospectus pages. Read the prospectus carefully before investing.
Investing involves risk, including possible loss of principal.
International investing involves risks, including risks related to foreign currency, limited liquidity, less government regulation and the possibility of substantial volatility due to adverse political, economic or other developments. These risks often are heightened for investments in emerging/ developing markets or in concentrations of single countries.
Diversification and asset allocation may not protect against market risk or loss of principal.
Fixed income risks include interest-rate and credit risk. Typically, when interest rates rise, there is a corresponding decline in the value of debt securities. Credit risk refers to the possibility that the debt issuer will not be able to make principal and interest payments.
Non-investment-grade debt securities (high-yield/junk bonds) may be subject to greater market fluctuations, risk of default or loss of income and principal than higher-rated securities.
An investment in the Fund is not insured or guaranteed by the Federal Deposit Insurance Corporation or any other government agency and its return and yield will fluctuate with market conditions.
Funds that concentrate investments in specific industries, sectors, markets or asset classes may underperform or be more volatile than other industries, sectors, markets or asset classes and than the general securities market.
An investment in fixed-income funds is not equivalent to and involves risks not associated with an investment in cash.
There is no guarantee that dividends will be paid.
There can be no assurance that an active trading market for shares of an ETF will develop or be maintained.
This material represents an assessment of the market environment as of the date indicated; is subject to change; and is not intended to be a forecast of future events or a guarantee of future results. This information should not be relied upon by the reader as research or investment advice regarding the funds or any issuer or security in particular.
The strategies discussed are strictly for illustrative and educational purposes and are not a recommendation, offer or solicitation to buy or sell any securities or to adopt any investment strategy. There is no guarantee that any strategies discussed will be effective.
The information presented does not take into consideration commissions, tax implications, or other transactions costs, which may significantly affect the economic consequences of a given strategy or investment decision.
This material contains general information only and does not take into account an individual’s financial circumstances. This information should not be relied upon as a primary basis for an investment decision. Rather, an assessment should be made as to whether the information is appropriate in individual circumstances and consideration should be given to talking to a financial professional before making an investment decision.
The information provided is not intended to be tax advice. Investors should be urged to consult their tax professionals or financial professionals for more information regarding their specific tax situations.
The Funds are distributed by BlackRock Investments, LLC (together with its affiliates, “BlackRock”).
The iShares Funds are not sponsored, endorsed, issued, sold or promoted by Bloomberg, BlackRock Index Services, LLC, Cboe Global Indices, LLC, Cohen & Steers, European Public Real Estate Association (“EPRA® “), FTSE International Limited (“FTSE”), ICE Data Indices, LLC, NSE Indices Ltd, JPMorgan, JPX Group, London Stock Exchange Group (“LSEG”), MSCI Inc., Markit Indices Limited, Morningstar, Inc., Nasdaq, Inc., National Association of Real Estate Investment Trusts (“NAREIT”), Nikkei, Inc., Russell, S&P Dow Jones Indices LLC or STOXX Ltd. None of these companies make any representation regarding the advisability of investing in the Funds. With the exception of BlackRock Index Services, LLC, who is an affiliate, BlackRock Investments, LLC is not affiliated with the companies listed above.
Neither FTSE, LSEG, nor NAREIT makes any warranty regarding the FTSE Nareit Equity REITS Index, FTSE Nareit All Residential Capped Index or FTSE Nareit All Mortgage Capped Index. Neither FTSE, EPRA, LSEG, nor NAREIT makes any warranty regarding the FTSE EPRA Nareit Developed ex-U.S. Index, FTSE EPRA Nareit Developed Green Target Index or FTSE EPRA Nareit Global REITs Index. “FTSE®” is a trademark of London Stock Exchange Group companies and is used by FTSE under license.
©2023 BlackRock, Inc or its affiliates. All Rights Reserved. BLACKROCK, iSHARES, iBONDS, ALADDIN and the iShares Core Graphic are trademarks of BlackRock, Inc. or its affiliates. All other trademarks are those of their respective owners.
This post originally appeared on the iShares Market Insights.
Credit: Source link


