
Torsten Asmus
On the backdrop of rising yields, bonds have suffered a horrendous past 2-3 years. For reference, the iShares 20+ Year Treasury Bond ETF (NASDAQ:TLT) is down about 42% for the trailing 36 months, as compared to a gain of almost 30% for the U.S. equity markets (S&P 500).
Seeking Alpha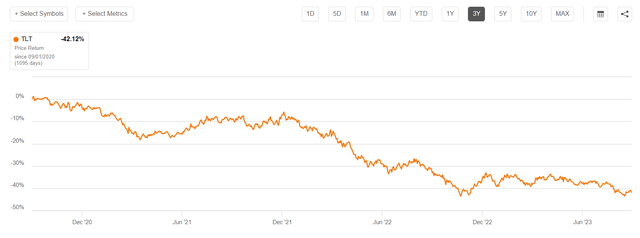
What is perhaps even more notable is the performance of U.S. treasuries over the past 10 years, as long-term bond holders have now suffered what could be called a “lost decade”.
Seeking Alpha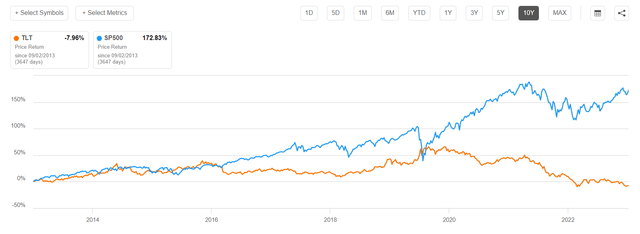
Although bonds have performed so badly over the past 3 and 10 years respectively, it is important to note that the past underperformance does not render U.S. treasuries, and fixed income securities more broadly, a bad investment. In fact, disappointing past performance in financial markets is only a reflection of changing sentiment and perception of risk/ value — something that has already been materialized. And to test whether investors can make money with securities going forward, the assessment should exclusively focus on the outlook.
The above said, I strongly believe that the next 12-24 months will likely mark a bull market in bonds. Because as the economy continues to signal downtrending inflation, paired with a resilient macro backdrop, yields are likely to drop from the 4.1% (long-dated) to 5.5% (short-dated) benchmark to more reasonable levels (I see 3% as likely); and bonds will re-rate accordingly. Remember the inverse relationship of bonds vs. yields: When yields on bonds drop, their prices are poised to go up as investors are willing to pay more for the same fixed interest payment, resulting in bond price appreciation.
Goldilocks Economic Data Supports Dovish Fed Pivot
On almost all dimensions, most recent economic data supports the argument for a dovish Fed shift: The latest U.S. jobs report, released on Friday 1st September, highlighted a slight increase in the unemployment rate for August. Furthermore, data from the Bureau of Labor Statistics revealed that job openings have declined to their lowest levels in approximately two years, and fewer Americans are voluntarily leaving their jobs.
This data, a cooling in the labor market, shows that the U.S. economy, while still robust, is starting to cool as consumers and businesses face higher borrowing costs. Needless to say, evidence of a slowing labor market is crucial input for the next Federal Reserve meeting in two weeks, during which Chair Jay Powell and officials are now expected to refrain from hiking, and maintain the federal funds rate in the range of 5.25% to 5.5%.
Further evidence of a soft landing, rendering additional rate hikes unlikely, has been given through the sharp slowdown in inflation. The latest CPI numbers for July highlight:
- Energy was -12.5% YoY, with gasoline dropping -19.9%
- Other commodities, excluding energy and food, increased by less than 1% YoY
- Food price increases stayed below 5% YoY; with the trend pointing to a slowdown
Overall, core inflation YoY for 2023 vs. 2022 slowed to 3.2%, trending closer to levels what the Fed likely considers “acceptable”.
Bureau of Labor Statistics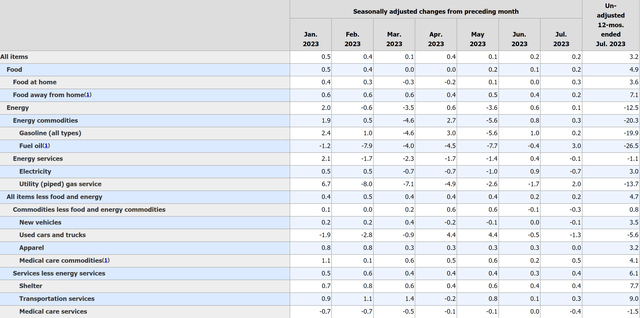
Lower Yields Poised To Catalyse Capital Gains For Fixed-Income Bulls
With inflation softening, and the labor market cooling, it is highly unlikely that the Fed will keep rates at the current 22+ years benchmark high for much longer, in my opinion. And traders agree with this assessment, as suggested by the deeply inverted yield curve, with the <1 year at close to 5.5% and the >10-year at about 4.25%.
worldgovernmentbonds.com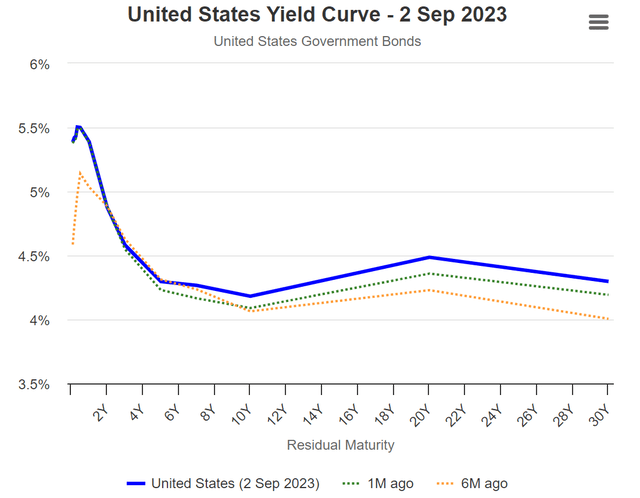
Reflecting on the latest economic data, I see the yield curve changing over the next 12-24 months. Specifically, as inflation will likely drop to 2.0% to 2.5% YoY, and modelling a 100 basis points premium for consumption deferral (real rate), the implied mid/-long term rate on the Treasurys should likely shift down towards 3% – 3.5%. Accordingly, this estimate would suggest a 150 – 175 basis point drop in yields.
So, what does that mean for bond investors? Expecting a 150 – 175 basis point drop in yields over the next 12-24 months, I calculate a 11% to 15% price appreciation on the 10-year (7.3 approximate, effective duration metric) and as much as 23% to 30% for longer duration securities (14.7 approximate, effective duration metric) such as on the iShares 20+ Year Treasury Bond ETF. Consequently, if my analysis is correct, Treasury investors are poised to enjoy equity-like capital gains.
If not Capital Gains, Then Juicy Yields
In case yields stay at their 22+ years high, then no price appreciation in Treasurys will materialize. However, even in this scenario, investors should again consider the attractive yields quoted on Treasurys: For reference, the 2-year Treasury bonds are offering a yield to maturity (YTM) of ~4.9%, while 10-year Treasury bonds are providing investors with a ~4.2% YTM.
These yields are attractive, especially considering that dividend-focused ETFs such as the Schwab U.S. Dividend Equity ETF (SCHD) only provide investors with a ~3.5% yield — despite assuming equity risk. Although the potential for bonds to see further price declines exists as interest rates continue to climb, there’s a larger safety cushion in place because yields have already experienced such an aggressive hiking cycle. And, the risk for price downside is arguably much larger for equities than for bonds — considering the current, respective price levels.
While I personally disagree with the statement that equities are expensive at ~20x FWD P/E for the S&P 500 (SP500), I understand that many investors are concerned about the outlook for stocks over a short/-midterms perspective. To this I say: why not lock in the ~4.9% YTM on the 2-year Treasury bonds, and see what equity markets are doing 12, or 24, months from now?
Conclusion
Treasurys have performed poorly over the past 2-3 years, but this doesn’t make them a bad investment. In fact, both short- and long-dated U.S. government bonds currently offer a very attractive yields compared to both inflation and dividend-focused ETFs. Moreover, as yields are likely to drop over the next 12-24 months on fading inflation and a dovish Fed shift, Treasurys are poised to celebrate a bull market — likely rewarding investors with equity-like capital gains. Expecting a 150 – 175 basis point drop in yields, I estimate that 10-year Treasurys may gain 11% to 15%, while the 20+ year Treasurys may appreciate by as much as 23% to 30%.
Credit: Source link