by Levi at Elliott Wave Trader; produced with Avi Gilburt.
The use of financial engineering will typically evoke a wide range of opinions among analysts. However, we’re not going to discuss the viability or rightness of such an approach. Rather, let’s focus on the structure of price on the chart and listen to what it’s telling us for Cisco Systems, Inc. (NASDAQ:CSCO).
It’s the fundamentals that point us to this conclusion. Follow along as Lyn Alden discusses her current view.
The Fundamentals Show Financial Engineering At Work
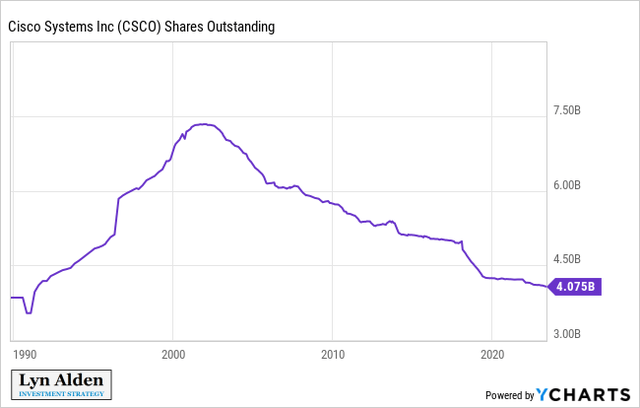
“Cisco in my opinion continues to be a useful long-term compounder and income source. The yield is lower than an investor can get with Treasuries, but the dividend consistently grows each year. A significant part of the earnings per share growth comes from the company aggressively using its cash flow to reduce its share count. At an earnings multiple in the mid-teens, and a mature degree of market saturation, this combined approach of growing dividends and share reduction makes sense.
FastGraph
YCharts
The risk that the company faces is that over time it can stagnate and its core products can become commoditized. The company has shifted more toward services and software based around its hardware, but some of their largest customers have in-housed some of types of hardware that Cisco offers. Overall, I have a moderately constructive outlook on Cisco, and consider it to be useful as a small part of a dividend stock portfolio.”
Lyn’s statement regarding stagnation is salient. How would we know when the market is souring on the current situation?
The Technicals Paint A Picture For Us
by Garrett Patten – StockWaves
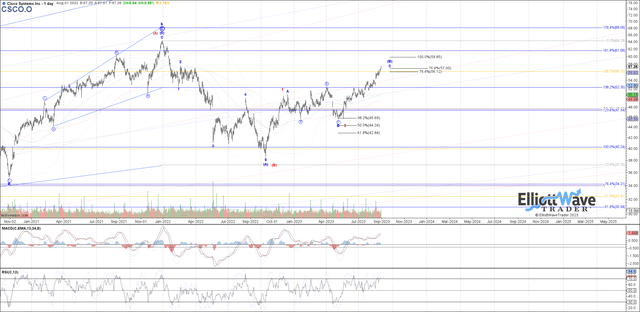
Note that we have two paths shown on this chart by Garrett. With Blue being the primary, we can discuss how that would play out and what would give us a clear sell setup. For the moment, we are showing CSCO as a “hold” since the [B] wave as drawn on the chart has not yet proved itself as complete.
That [B] wave can extend to as high as the $60 region. There are enough waves in place to consider [B] as complete now but we do not yet have a strong signal in place to give us a sell sign on the chart. We’ll discuss the anatomy of a sell signal next.
For the moment, our primary path suggests that the $57 – $60 region may represent a significant high in price. And, in time, it may be telling us that the larger structure is pointing back down to the $30’s.
It would be an initial 5 waves down from this current area that could give us a sell signal.
Risk: should price move strongly through the $60 level then it would target $64-$66 next. Ultimately, it could move as high as $74 in the Red path.
How A Sell Signal Sets Up
Our preferred analysis methodology works in both up and down markets. The highest probability sell setup takes shape when we complete a “B” wave, as is the case here. As previously mentioned above, since we are yet to form an initial 5 waves down from our [B] wave target, this chart is a “hold.” But, when that first 5 forms and then we see a corrective 3 wave bounce, that gives us a low-risk opportunity to play this as a short with risk being the prior high struck at [B].
It is in a [C] wave down that we are able to use our Fibonacci Pinball structure to properly track and protect profits.
Fibonacci Pinball With Avi Gilburt
“While I was learning Elliott Wave on my own, I was trying to obtain a more ‘track-able’ and ‘tradable’ understanding of the fractal nature of the markets. This is probably what many struggle with the most. Specifically, it is when we say that within a 5 wave move, each impulsive wave breaks down further into 5 waves each, with some waves becoming extended.
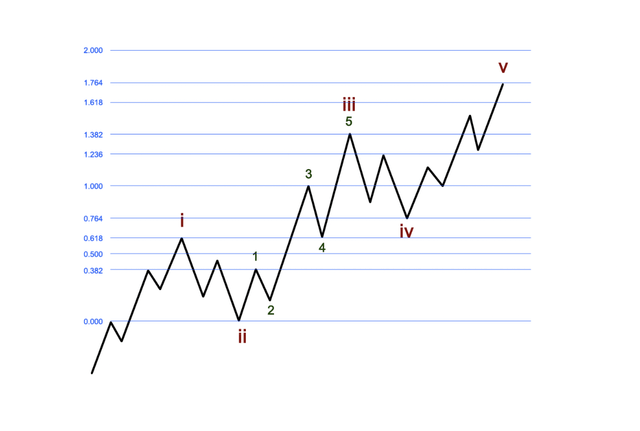
Well, after much analysis and observation, I identified a standardized method to trade waves 3-5, once waves 1 and 2 were in place. Now, remember that this is a standardized method that is a most common phenomenon in the market, but markets can and do vary from this standardized presentation. In fact, when we deal with commodities or the VXX, often, we see extensions that far surpass the standardized extensions I present here. But, again, this scenario is seen very often in the markets and individual stocks, so I believe it is worthwhile to have a basic understanding of this structure to build upon.
This is something that I observed within the Elliott Wave structure, and have adapted it to a trading methodology, which I lovingly call Fibonacci Pinball.” – Avi Gilburt.
Pinball by Avi Gilburt – Elliott Wave Trader
To apply how this would work with CSCO, simply turn the above chart upside down and replicate the structure.
Conclusion
We have an extensive Education library available at Elliott Wave Trader. As well, we want to teach others this methodology. Three times a week we have beginner and intermediate level videos where we show the exact way we count the waves and give in-depth analysis techniques. This methodology, if you give it the chance, will change the way you invest forever. More on that can be found here.
There are many ways to analyze and track stocks and the market they form. Some are more consistent than others. For us, this method has proved the most reliable and keeps us on the right side of the trade much more often than not. Nothing is perfect in this world, but for those looking to open their eyes to a new universe of trading and investing, why not consider studying this further? It may just be one of the most illuminating projects you undertake.
(Housekeeping Matters)
If you would like notifications as to when our new articles are published, please hit the button at the bottom of the page to “Follow” us.