

• bitcoinBitcoin(BTC)$79,938.000.27%
  • ethereumEthereum(ETH)$2,499.291.66%
  • tetherTether(USDT)$1.00-0.01%
  • binancecoinBNB(BNB)$755.18-0.72%
  • rippleXRP(XRP)$1.420.35%
  • usd-coinUSDC(USDC)$1.000.00%
  • solanaSolana(SOL)$106.873.82%
  • tronTRON(TRX)$0.3352100.65%
  • Figure HelocFigure Heloc(FIGR_HELOC)$1.061.52%
  • HyperliquidHyperliquid(HYPE)$89.094.66%
  • zcashZcash(ZEC)$1,169.8515.73%
  • dogecoinDogecoin(DOGE)$0.0898223.04%
  • RainRain(RAIN)$0.0170083.51%
  • moneroMonero(XMR)$538.68-1.04%
  • USDSUSDS(USDS)$1.00-0.02%
  • chainlinkChainlink(LINK)$12.273.78%
  • whitebitWhiteBIT Coin(WBT)$73.680.65%
  • leo-tokenLEO Token(LEO)$9.330.71%
  • cardanoCardano(ADA)$0.2204081.98%
  • stellarStellar(XLM)$0.1863181.08%
  • bitcoin-cashBitcoin Cash(BCH)$258.592.92%
  • daiDai(DAI)$1.000.00%
  • uniswapUniswap(UNI)$7.0312.55%
  • CantonCanton(CC)$0.1102680.73%
  • Ethena USDeEthena USDe(USDE)$1.00-0.01%
  • USD1USD1(USD1)$1.000.00%
  • litecoinLitecoin(LTC)$54.271.32%
  • the-open-networkGram (prev. Toncoin)(GRAM)$1.42-0.47%
  • hedera-hashgraphHedera(HBAR)$0.0811190.31%
  • avalanche-2Avalanche(AVAX)$7.681.89%
  • suiSui(SUI)$0.80-0.70%
  • Global DollarGlobal Dollar(USDG)$1.00-0.02%
  • shiba-inuShiba Inu(SHIB)$0.000005-0.40%
  • nearNEAR Protocol(NEAR)$2.345.40%
  • paypal-usdPayPal USD(PYUSD)$1.00-0.01%
  • BlackRock USD Institutional Digital Liquidity FundBlackRock USD Institutional Digital Liquidity Fund(BUIDL)$1.000.00%
  • crypto-com-chainCronos(CRO)$0.0572301.24%
  • tether-goldTether Gold(XAUT)$4,421.97-0.09%
  • Circle USYCCircle USYC(USYC)$1.140.00%
  • MemeCoreMemeCore(M)$1.131.48%
  • Ripple USDRipple USD(RLUSD)$1.000.00%
  • okbOKB(OKB)$113.560.35%
  • BittensorBittensor(TAO)$243.032.10%
  • Ondo US Dollar YieldOndo US Dollar Yield(USDY)$1.150.00%
  • AsterAster(ASTER)$0.78-6.76%
  • aaveAave(AAVE)$134.873.22%
  • mantleMantle(MNT)$0.614.47%
  • pax-goldPAX Gold(PAXG)$4,427.69-0.11%
  • OndoOndo(ONDO)$0.3780281.44%
  • World Liberty FinancialWorld Liberty Financial(WLFI)$0.0568130.61%
TradePoint.io
  • Main
  • AI & Technology
  • Stock Charts
  • Market & News
  • Business
  • Finance Tips
  • Trade Tube
  • Blog
  • Shop
No Result
View All Result
TradePoint.io
No Result
View All Result

That Syncing Feeling | Seeking Alpha

September 5, 2023
in Market & News
Reading Time: 4 mins read
A A
That Syncing Feeling | Seeking Alpha
ShareShareShareShareShare

tadamichi

YOU MAY ALSO LIKE

L.A. ‘graffiti towers’ to be cleaned in 90 days

Limbach: The Stock Has Room To Grow Again (NASDAQ:LMB)

By Dewi John

Bond and equity fund correlations have trended up this century

Increasing equity-bond correlations over decades poses questions for traditional portfolio construction.

The perceived low correlation between equity and bond returns is the basis of the construction of the “balanced” portfolio. The split between equities and bonds provides diversification benefits that should lead to better risk-adjusted returns over the longer term. Indeed, multi-asset sales (particularly those with a stronger equity tilt) have proven popular over the past three years, despite ongoing volatility and swings in market leadership.

A recent study by FTSE Russell has noted that for most of the past year, stocks and bonds “have moved in virtual lockstep, undermining faith in the long-term efficacy of this classic framework”. Over the period, the two-month-rolling correlation coefficient between the FTSE Global All-World equity index and the FTSE World Government Bond Index grew sharply positive, breaching 0.8 in February, and reaching a 10-year peak of 0.86 at the end of March.

FTSE Russell notes that equity-bond correlations spike during bouts of high market anxiety, such as the Taper Tantrum in 2013, at the start of Fed tightening in December 2015, and as post-lockdown inflation gained traction. All of these situations saw falls in both equities and bonds.

The increase in asset class correlation during times of market stress has been well-documented, with one study noting that “there appears to be more co-movements among the various asset classes during periods of global shocks. This seems to be more pronounced in the case of the Covid pandemic”, while another observed “during the current financial crisis, many of these asset classes experienced high degrees of correlation as they all decreased in value” and that “many asset classes can be highly correlated in a downturn”.

I ran rolling three-year monthly correlations1 of all equity funds and bond funds registered for sale in the UK and noted that correlations spike broadly at the mid-point of the 36-month period during times of market stress. Correlations peak for the period ending December 2009 (0.662) and December 2022 (0.704), these periods capturing the Global Financial Crisis and COVID crisis at broadly the same point (Chart 1).

Chart 1: Rolling 36-Month Equity-Bond Fund Correlation
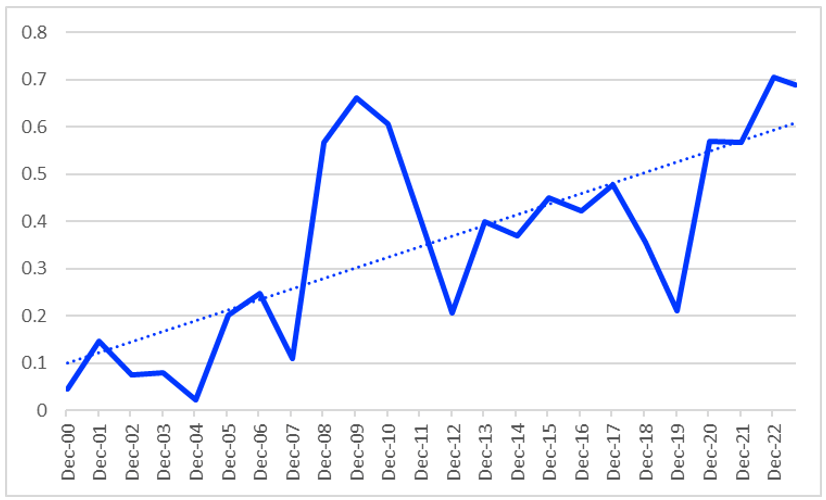
Chart showing rolling 36-month equity-bond fund correlation

Source: LSEG Lipper

What’s also clear from the chart is that this hasn’t just been happening during periods of market stress, but that the overall trend has been to higher equity-bond correlation. The mean correlation from 2000 to 2007 is 0.092, and from 2008 to YTD, 0.442. That’s a significant increase over the two-plus decades. What’s interesting is that this hasn’t led to an increase in the average volatility of multi-asset funds, using the Lipper Global Classification, Mixed Asset GBP Balanced as an example – indeed, there’s a slight negative relationship that increases in strength when annualised standard deviation is moved one, then two, years back from the end of the 36-month rolling volatility period. Though, rather less surprisingly, the peaks in volatility are 2008 and 2020.

It’s not altogether clear what’s causing this, although it’s likely that quantitative easing, in supporting financial asset prices in general, has increased correlations. What also seems likely is that quantitative tightening won’t initially weaken the relationship, as withdrawing support will pull in the same direction for batch asset classes. What is worth considering, though, is that correlations are at around the level they were at during the Global Financial Crisis, so would likely surpass this in the event of additional market stress.

____________

1 To year-end, plus one of 36 months to the end of August 2023

The views expressed are the views of the author and not necessarily those of LSEG Lipper. This material is provided as market commentary and for educational purposes only and does not constitute investment research or advice. LSEG Lipper cannot be held responsible for any direct or incidental loss resulting from applying any of the information provided in this publication or from any other source mentioned. Please consult with a qualified professional for financial advice.

Original Post

Editor’s Note: The summary bullets for this article were chosen by Seeking Alpha editors.

Credit: Source link

ShareTweetSendSharePin

Related Posts

L.A. ‘graffiti towers’ to be cleaned in 90 days
Market & News

L.A. ‘graffiti towers’ to be cleaned in 90 days

September 6, 2026
Limbach: The Stock Has Room To Grow Again (NASDAQ:LMB)
Market & News

Limbach: The Stock Has Room To Grow Again (NASDAQ:LMB)

September 6, 2026
UN votes to endorse new map projection that shows Africa's size more accurately – CBS News
Market & News

UN votes to endorse new map projection that shows Africa's size more accurately – CBS News

September 6, 2026
Wildfires burn across Sicily, prompting evacuations
Market & News

Wildfires burn across Sicily, prompting evacuations

September 6, 2026
Next Post
Apple Said to Plan Move From Intel to Mac Chips

Apple Said to Plan Move From Intel to Mac Chips

Leave a Reply Cancel reply

Your email address will not be published. Required fields are marked *

Search

No Result
View All Result
Where Baked by Melissa finds her inspiration

Where Baked by Melissa finds her inspiration

September 5, 2026
Elon Musk launches steering-wheel-free Tesla Cybercabs

Elon Musk launches steering-wheel-free Tesla Cybercabs

September 3, 2026
Microsoft Has Proven That An ROI Is Possible (NASDAQ:MSFT)

Microsoft Has Proven That An ROI Is Possible (NASDAQ:MSFT)

September 4, 2026

About

Learn more

Our Services

Legal

Privacy Policy

Terms of Use

Bloggers

Learn more

Article Links

Contact

Advertise

Ask us anything

©2020- TradePoint.io - All rights reserved!

Tradepoint.io, being just a publishing and technology platform, is not a registered broker-dealer or investment adviser. So we do not provide investment advice. Rather, brokerage services are provided to clients of Tradepoint.io by independent SEC-registered broker-dealers and members of FINRA/SIPC. Every form of investing carries some risk and past performance is not a guarantee of future results. “Tradepoint.io“, “Instant Investing” and “My Trading Tools” are registered trademarks of Apperbuild, LLC.

This website is operated by Apperbuild, LLC. We have no link to any brokerage firm and we do not provide investment advice. Every information and resource we provide is solely for the education of our readers. © 2020 Apperbuild, LLC. All rights reserved.

No Result
View All Result
  • Main
  • AI & Technology
  • Stock Charts
  • Market & News
  • Business
  • Finance Tips
  • Trade Tube
  • Blog
  • Shop

© 2023 - TradePoint.io - All Rights Reserved!