
• bitcoinBitcoin(BTC)$78,601.00-0.41%
  • ethereumEthereum(ETH)$2,487.980.18%
  • tetherTether(USDT)$1.000.00%
  • binancecoinBNB(BNB)$749.041.47%
  • rippleXRP(XRP)$1.411.46%
  • usd-coinUSDC(USDC)$1.000.01%
  • solanaSolana(SOL)$103.07-0.04%
  • tronTRON(TRX)$0.3388561.21%
  • Figure HelocFigure Heloc(FIGR_HELOC)$1.040.00%
  • zcashZcash(ZEC)$1,182.724.81%
  • HyperliquidHyperliquid(HYPE)$85.371.54%
  • dogecoinDogecoin(DOGE)$0.089580-0.36%
  • RainRain(RAIN)$0.015986-1.69%
  • USDSUSDS(USDS)$1.000.02%
  • whitebitWhiteBIT Coin(WBT)$81.396.52%
  • moneroMonero(XMR)$500.27-1.79%
  • chainlinkChainlink(LINK)$12.41-1.60%
  • leo-tokenLEO Token(LEO)$9.230.30%
  • cardanoCardano(ADA)$0.216933-0.64%
  • stellarStellar(XLM)$0.186885-1.19%
  • bitcoin-cashBitcoin Cash(BCH)$256.55-0.08%
  • daiDai(DAI)$1.000.01%
  • Ethena USDeEthena USDe(USDE)$1.000.01%
  • USD1USD1(USD1)$1.00-0.01%
  • CantonCanton(CC)$0.1080912.04%
  • uniswapUniswap(UNI)$6.77-3.26%
  • litecoinLitecoin(LTC)$53.93-2.44%
  • the-open-networkGram (prev. Toncoin)(GRAM)$1.390.25%
  • hedera-hashgraphHedera(HBAR)$0.078534-3.78%
  • avalanche-2Avalanche(AVAX)$7.95-1.33%
  • Global DollarGlobal Dollar(USDG)$1.00-0.01%
  • suiSui(SUI)$0.81-1.87%
  • shiba-inuShiba Inu(SHIB)$0.000005-1.36%
  • nearNEAR Protocol(NEAR)$2.28-1.20%
  • crypto-com-chainCronos(CRO)$0.0607896.56%
  • paypal-usdPayPal USD(PYUSD)$1.000.02%
  • BlackRock USD Institutional Digital Liquidity FundBlackRock USD Institutional Digital Liquidity Fund(BUIDL)$1.000.00%
  • MemeCoreMemeCore(M)$1.203.18%
  • tether-goldTether Gold(XAUT)$4,376.45-1.12%
  • Circle USYCCircle USYC(USYC)$1.140.01%
  • BittensorBittensor(TAO)$255.26-0.62%
  • Ripple USDRipple USD(RLUSD)$1.000.02%
  • okbOKB(OKB)$114.11-1.84%
  • Ondo US Dollar YieldOndo US Dollar Yield(USDY)$1.150.02%
  • mantleMantle(MNT)$0.631.67%
  • polkadotPolkadot(DOT)$1.2011.55%
  • AsterAster(ASTER)$0.75-1.20%
  • aaveAave(AAVE)$128.20-2.15%
  • pax-goldPAX Gold(PAXG)$4,380.16-1.14%
  • Pump.funPump.fun(PUMP)$0.0043830.53%
TradePoint.io
  • Main
  • AI & Technology
  • Stock Charts
  • Market & News
  • Business
  • Finance Tips
  • Trade Tube
  • Blog
  • Shop
No Result
View All Result
TradePoint.io
No Result
View All Result

After Some Wavering, Corp. Bond Market Adjusts To Tightest Monetary Policies In Decades

August 31, 2023
in Market & News
Reading Time: 4 mins read
A A
After Some Wavering, Corp. Bond Market Adjusts To Tightest Monetary Policies In Decades
ShareShareShareShareShare

TERADAT SANTIVIVUT

Record QT and big rate hikes no problem: Corporate Bond Market Distress Index drops to lowest level since before the Fed started tightening.

The New York Fed’s update on Wednesday of its weekly Corporate Bond Market Distress Index (CMDI) shows just how much liquidity there is still sloshing around from years of mega QE, and how yield-chasing has resurged this year, despite the Fed’s hiking its policy rates to the highest levels in 22 years and despite the biggest QT ever.

This index of distress in the corporate bond market, after spiking early in the tightening cycle, fell to 0.13 over the past two weeks, the lowest level since before this tightening cycle began:
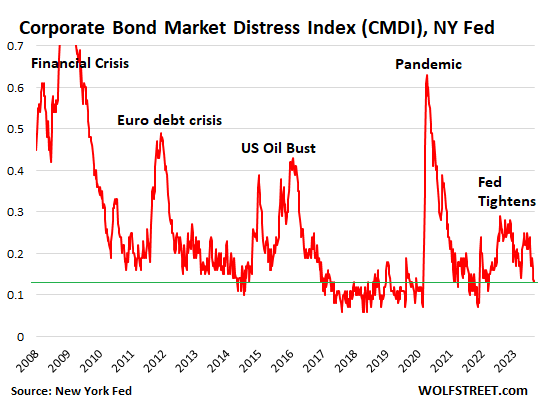
Corporate Bond Market Distress Index

“The index identifies as ‘distress’ periods during which a large number of individual measures of market functioning indicate deteriorating conditions in both the primary and the secondary markets for corporate bonds,” the New York Fed says.

“Corporate bond market functioning appears healthy. The end-of-month market-level CMDI is below its historical 20th percentile,” the New York Fed says.

YOU MAY ALSO LIKE

Tracking Prem Watsa's Fairfax Financial Holdings Portfolio – Q2 2026 Update

Lindsay Clancy juror speaks after mistrial: "There was so much doubt" – CBS News

“Market functioning in both the high-yield and investment-grade sectors improved during the course of August,” the New York Fed says.

In other words, after some initial wavering, the corporate bond market has easily adjusted to the much tighter monetary policies and returned to la-la-land.

One reason to track distress is to see how far the Fed can go with its tightening before it does some real damage to the corporate bond market. And the index shows that compared to the other moments of damage – even the lesser ones of the Euro debt crisis and the US Oil Bust – there hasn’t been any damage. The index is now back in its historical comfort zone.

Even the junk bond market remains in its comfort zone. The New York Fed also provides the sub-indices for distress in the investment grade segment and in the junk-rated (high yield) segment of the corporate bond market.

The High Yield CMDI tracks junk bonds that are rated BB+ and below but above CCC/C, so not including the low end of the junk bond market (here is my table of corporate bond credit ratings by ratings agency).

This High Yield CMDI fell to 0.16 this today, and after the two brief spikes has returned to its comfort zone:
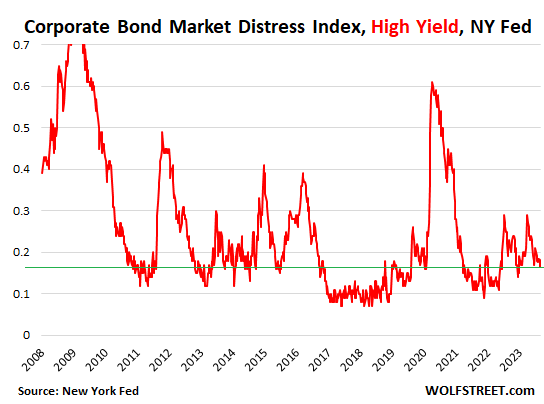
High Yield CMDI

To deal with the worst inflation in 40 years, the Fed has attempted to “tighten” financial conditions with rate hikes and QT. Tighter financial conditions would make borrowing for companies and consumers harder to get and more expensive, and would create a little more distress among borrowers, especially those with weaker credit, such as junk-rated companies, and would therefore reduce investment and demand in the economy and thereby remove some inflationary pressures. So the theory goes.

During this tightening cycle, the New York Fed came up with the CMDI to track the effects of this tightening on the corporate bond market. It complements a whole slew of indices attempting to measure financial stress, but is specifically addressing distress in the corporate bond market.

And at first, the effects were as promised: In late 2021, when the Fed started talking about tapering, rate hikes, and QT, financial distress in the corporate bond market began to rise from historically low levels, in anticipation of what might come.

By November 2022, with rate hikes and QT in full swing, the CMDI had risen to 0.28, the highest level since November 2020, when it was coming down from the lockdown shock.

But since then, it has wobbled lower, showing that there is now less distress in the corporate bond market than before the Fed even started tightening.

The CMDI includes primary market measures from the Mergent Fixed Income Securities Database (FISD), such as issuance volumes, primary market pricing, and issuer characteristics.

It includes secondary market measures, such as trading data from TRACE, and measures that reflect central tendencies and other aspects of the distributions, of volume, liquidity, nontraded bonds, spreads, and default-adjusted spreads. And it includes quoted prices from ICE Bank of America to track the differential secondary market conditions for traded and non-traded bonds.

Original Post

Editor’s Note: The summary bullets for this article were chosen by Seeking Alpha editors.

Credit: Source link

ShareTweetSendSharePin

Related Posts

Tracking Prem Watsa's Fairfax Financial Holdings Portfolio – Q2 2026 Update
Market & News

Tracking Prem Watsa's Fairfax Financial Holdings Portfolio – Q2 2026 Update

September 9, 2026
Lindsay Clancy juror speaks after mistrial: "There was so much doubt" – CBS News
Market & News

Lindsay Clancy juror speaks after mistrial: "There was so much doubt" – CBS News

September 9, 2026
Watches, warnings discontinued as Hurricane Lowell pulls away from Hawaii – Hawaii News Now
Market & News

Watches, warnings discontinued as Hurricane Lowell pulls away from Hawaii – Hawaii News Now

September 8, 2026
Micron: Left In The Dirt As Peers Continue To Outperform It
Market & News

Micron: Left In The Dirt As Peers Continue To Outperform It

September 8, 2026
Next Post
Red Hat Delivers Holiday Earnings Gift

Red Hat Delivers Holiday Earnings Gift

Leave a Reply Cancel reply

Your email address will not be published. Required fields are marked *

Search

No Result
View All Result
Stocks Could Fall 10% — Here’s The Pullback Playbook

Stocks Could Fall 10% — Here’s The Pullback Playbook

September 2, 2026
Peak Coal, Postponed Again | Seeking Alpha

Peak Coal, Postponed Again | Seeking Alpha

September 7, 2026
Connecticut firefighters rescue children from floods

Connecticut firefighters rescue children from floods

September 6, 2026

About

Learn more

Our Services

Legal

Privacy Policy

Terms of Use

Bloggers

Learn more

Article Links

Contact

Advertise

Ask us anything

©2020- TradePoint.io - All rights reserved!

Tradepoint.io, being just a publishing and technology platform, is not a registered broker-dealer or investment adviser. So we do not provide investment advice. Rather, brokerage services are provided to clients of Tradepoint.io by independent SEC-registered broker-dealers and members of FINRA/SIPC. Every form of investing carries some risk and past performance is not a guarantee of future results. “Tradepoint.io“, “Instant Investing” and “My Trading Tools” are registered trademarks of Apperbuild, LLC.

This website is operated by Apperbuild, LLC. We have no link to any brokerage firm and we do not provide investment advice. Every information and resource we provide is solely for the education of our readers. © 2020 Apperbuild, LLC. All rights reserved.

No Result
View All Result
  • Main
  • AI & Technology
  • Stock Charts
  • Market & News
  • Business
  • Finance Tips
  • Trade Tube
  • Blog
  • Shop

© 2023 - TradePoint.io - All Rights Reserved!