
onurdongel
Skyline Champion Corporation (NYSE:SKY) produces modular homes and related products. As the company is facing harder times with the slowdown in the real estate market after an inflated modular home market related to Covid, the company’s earnings are beginning to deteriorate. In my opinion the company’s deteriorating earnings aren’t completely priced into the stock, constituting a sell-rating.
The Company
Skyline manufactures mostly HUD-Coded and modular homes in the United States. Around 92% of the company’s revenues are related to US Housing according to the company’s investor presentation, of which 88% relates to HUD-Coded homes, making the segment clearly Skyline’s largest, holding a majority of revenues:
US Segments (Skyline May Investor Presentation)
Compared to modular homes, HUD-Coded homes have to be manufactured within U.S. Department of Housing and Urban Development’s guidelines; for example, HUD-Coded homes need to be built on a permanent chassis.
Skyline operates multiple brands, as the company holds brands such as Skyline, Champion Home Builders, and Silvercrest:
Brands and Offering (Skyline May Investor Presentation)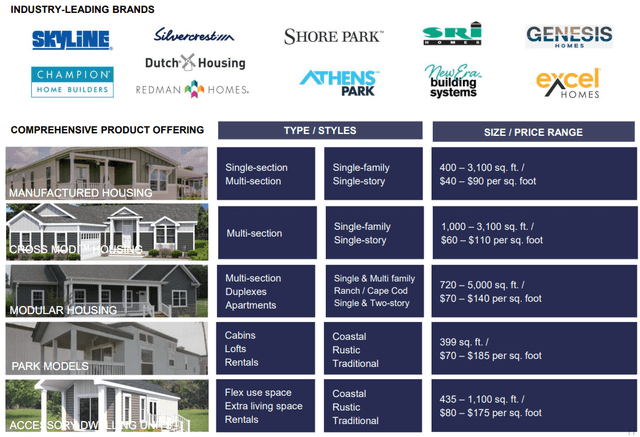
The brands’ clear similarities is the offering of manufactured and modular homes, that provide customers with quite cheap options for houses – the company’s prices range from $40 to $185 per square foot, making the building costs cheap compared to most alternatives.
Financials
As housing prices have soared in recent years, Skyline has seen a great increase in demand in FY22 and FY23 – in FY22 the company’s revenues grew by 55% with a further increase of 18% in FY23. These increases have turned into decreasing revenues in the most recent quarters as consumers’ purchasing power and the real estate market have seen cooldowns – in Q1 of FY24, Skyline’s revenues shrunk by 36%, with similar decreases expected in the coming quarters. On a more long-term basis, Skyline has achieved some growth – for example before the Covid-boosted market, the company’s revenues grew by a compounded annual rate of 11.6% from FY15 to FY21:
Skyline’s Revenues (Seeking Alpha)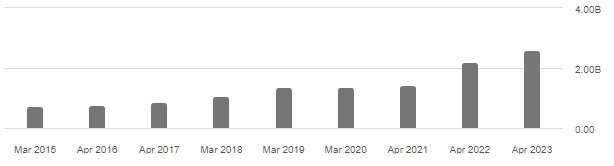
Skyline’s operating margin has seen a vast increase throughout the company’s financial history – in FY15 the company achieved a margin of 0.21%, whereas the margin for FY23 is 19.9%:
Skyline’s Operating Margin (Tikr)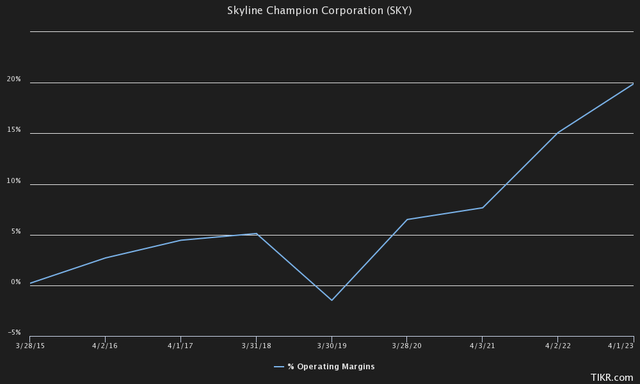
The margin of 19.9% doesn’t seem to be sustained by the company, as in Q1 of FY24 the company’s operating margin fell by 8.9 percentage points from 21.6% to 12.7%; I believe the company’s margin has been boosted by the Covid-surge and are coming back to more sustainable levels.
Skyline has a cash balance of almost $800 million, with outstanding interest-bearing debts of only around $12 million in long-term debt; the company’s balance sheet doesn’t pose any risks to the company’s operations. The company does not currently pay out any dividends, leaving investors wondering where the cash balance is going to be allocated. Skyline’s capital expenditures also seem to be low compared to the company’s market capitalization of around $3.7 billion, as the company’s trailing capital expenditures are only $53.2 million – the cash balance could leave room for sizable M&A activity.
Valuation
As analysts have an average price target of $72 compared to the stock’s current price of $64.81, the stock seems to have moderate upside in Wall Street analysts’ opinion. The stock currently trades at a NTM price-to-earnings ratio of around 19.3, a bit below the company’s all-time average of 22.3:
Historical P/E Ratio (Tikr)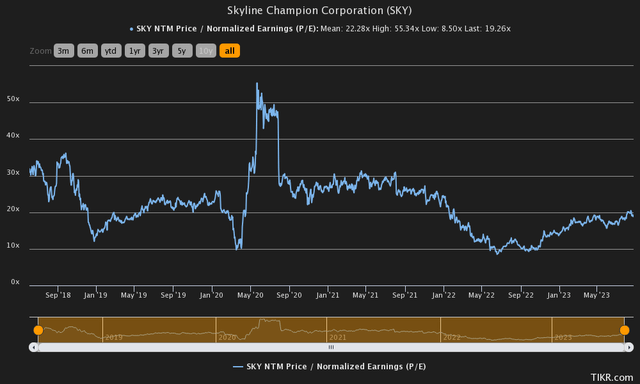
A simple price-to-earnings ratio simplifies a company’s valuation to a single number, giving investors only a limited view of the expected rate of return. To get a more in-depth view, I constructed a discounted cash flow model to illustrate a scenario and an estimated fair value for the company.
In the DCF model, I estimate Skyline’s revenues to decrease by 27% from the previous year, meaning a slightly lower decrease in coming quarters compared to Q1’s decrease of 36%. As market conditions normalize, I believe Skyline should achieve a good growth of 13% in FY25, with the growth slowing into very moderate growth in the future, ending up at two percent.
The company’s operating margin saw a decrease of almost nine percentage points in Q1. In the model I estimate Skyline’s operating margin to fall by a bit over eight percentage points in the entire year. Going forward, I do expect that the operating margin should increase by a bit as the real estate market goes back to normal – the company’s operating margin ends up at 13.24% for FY33, a margin that’s clearly above Skyline’s long-term average. As Skyline’s capital expenditures have been quite minimal in the past and I don’t expect a ton of growth in the model, I estimate Skyline to convert earnings into free cash flow quite well.
These expectations along with a cost of capital of 13.75% craft the following DCF model scenario, with an estimated fair value of $45.09 for the stock, around 30 percent below the current price:
DCF Model of SKY (Author’s Calculation)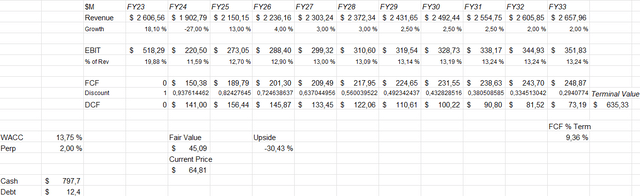
The used weighed average cost of capital of 13.75% is derived from a capital asset pricing model:
CAPM of SKY (Author’s Calculation)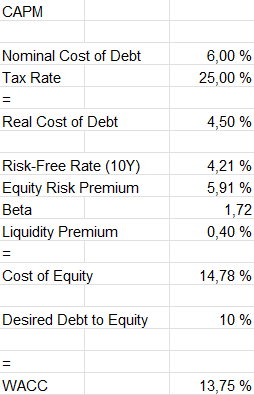
As Skyline has almost no debt, the company’s interest rate is difficult to determine – I input a figure of six percent, a rate that’s above the United States’ 10-year bond yield, and a quite typical current rate for a company such as Skyline. I expect Skyline to have a long-term debt to equity ratio of around 10%, a rate that’s considerably low, yet above the current level.
On the cost of equity side, I use the United States’ 10-year bond yield of 4.21% as the risk-free rate. The estimated equity risk premium of 5.91% is taken from Professor Aswath Damodaran’s estimates for the United States. The high beta of 1.72 is Tikr’s estimate. Finally, I add a small liquidity premium of 0.4% to the cost of equity, crafting a cost of equity of 14.78% and a WACC of 13.75%.
How I’d Turn Bullish
The DCF model has variables that I would maintain as the baseline scenario for the company. If Skyline demonstrates revenue growth that is well above my moderate estimates, I could turn bullish on the stock; as Skyline has fell on hard times, I don’t currently have good visibility into the company’s future growth, constituting the estimates that are below the company’s historical average.
As with the revenues, Skyline could prove that their sustainable operating margin is above my estimate. The company does have strategies around these financial metrics to increase revenues and margins, but as the visibility into Skyline’s margin future is quite low in my opinion, I see reasonable to have conservative estimates for the future. A good implementation of Skyline’s strategies could put the company’s financials ahead of my estimates:
Skyline’s Strategies (Skyline May Investor Presentation)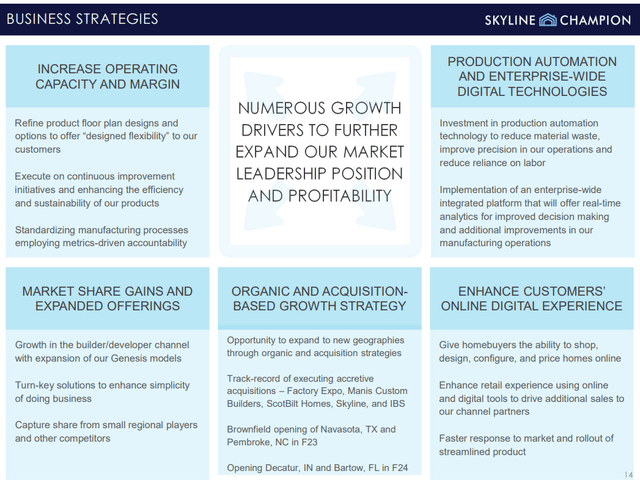
For the time being, I still have a conservative approach to the valuation.
Takeaway
At $64.81 a share, I believe the company’s currently deteriorating bottom line poses a risk for investors. Although Skyline could be a good investment given that the company implements business strategies well, I currently have a sell-rating given my DCF model’s estimated downside of 30%.
Credit: Source link