

jetcityimage
A few months ago, I wrote a cautious piece on the YieldMax TSLA Option Income Strategy ETF (NYSEARCA:TSLY), warning conservative income-oriented investors to avoid it, despite TSLY’s headline grabbing 74.5% distribution rate (Figure 1).
Figure 1 – TSLY claims to yield 74.5% (elevateshares.com)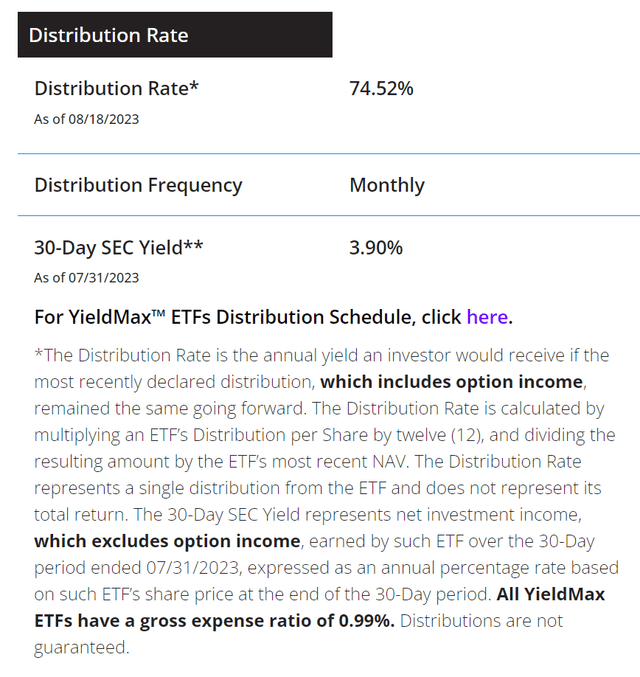
TSLY’s distribution rate is highly misleading and is not indicative of future distributions nor the ETF’s total return. It is simply calculated from the ETF’s most recent distribution per share, annualized, at the current ETF price.
In fact, since my article, while the TSLY ETF has paid $1.8964 / share in distributions (which is a 68% annualized yield on the price at publication of $16.74), the TSLY ETF has actually delivered -10.7% in total returns (Figure 2).
Figure 2 – TSLY has returned -10.7% since my June article (Seeking Alpha)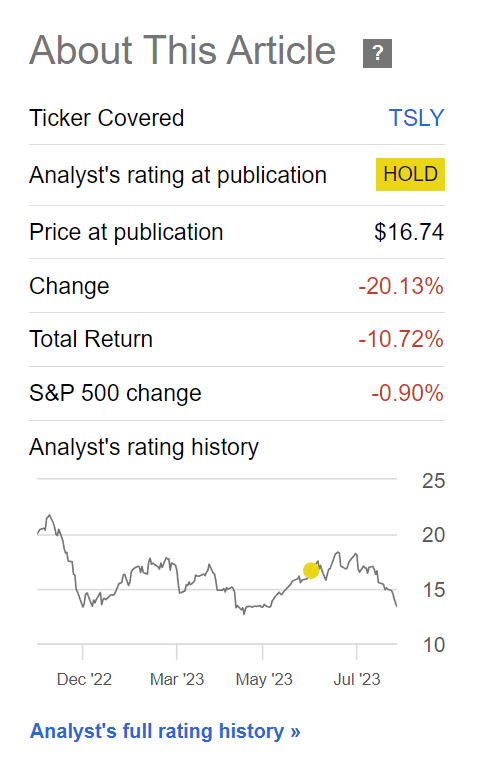
Simply put, the TSLY ETF is applying a premium-harvesting derivatives strategy to an extremely volatile asset, Tesla Inc. (TSLA) shares. So total returns on such a strategy will likewise be very volatile and may not be suitable for income-oriented investors.
Brief Fund Overview
The YieldMax TSLA Option Income Strategy ETF seeks to generate monthly income by writing call options on Tesla stock to harvest the option premium yield. The TSLY ETF will also invest excess cash into treasuries to earn additional income.
To achieve its objective, the TSLY ETF first creates a synthetic long exposure to TSLA stock by selling long-dated at the money (“ATM”) puts while simultaneously buying long-dated ATM calls (Figure 3).
Figure 3 – Illustrative synthetic long exposure (Optionsplaybook.com)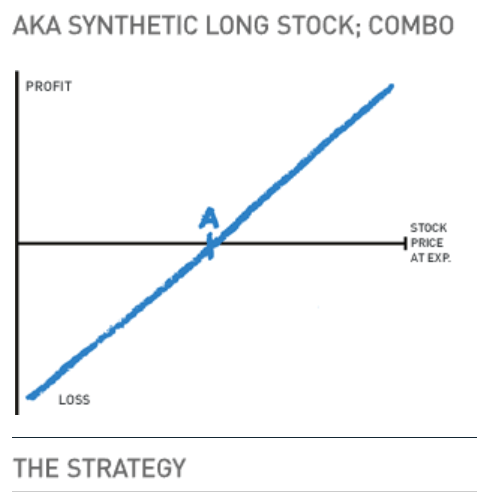
Against this long-dated synthetic long position, the TSLY ETF will write short-dated out of the money (“OTM”) calls to harvest the premium income. The options written will typically be 5-15% OTM, which will limit the fund’s participation in the upside to TSLA’s stock price if TSLA shares increase during the option time period.
Figure 4 shows TSLY’s current holdings. TSLY has a synthetic long with September 15th expiry and strike price $265 (probably struck months ago), while it has sold weekly calls on TSLA stock with strikes ranging from $225 to $237.50.
Figure 4 – TSLY current holdings (elevateshares.com)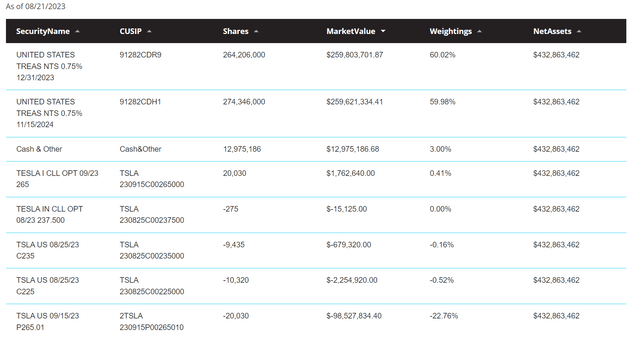
Downside Of Strategy In Full Display
According to Investopedia, “a covered call will limit the investor’s potential upside profit and may not offer much protection if the stock price drops.” That is indeed what happened for TSLY as TSLA’s stock price has nose-dived in recent weeks, declining from July 18’s peak at $299 / share to $215 / share as of August 18 (Figure 5).
Figure 5 – TSLA stock price (stockcharts.com)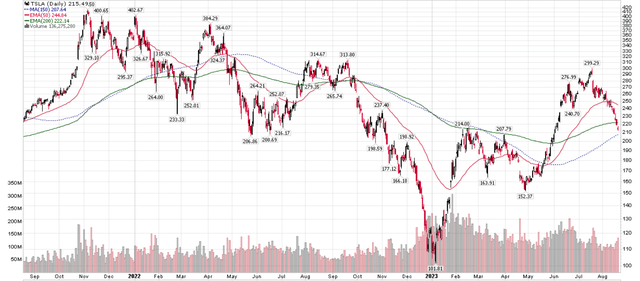
Due to the capped upside/uncapped downside nature of the covered call strategy, TSLY has almost matched the sharp drawdown in TSLA shares by declining 22.8% in total returns since July 18 (Figure 6).
TSLY has almost matched TSLA’s downside during this drawdown (Seeking Alpha)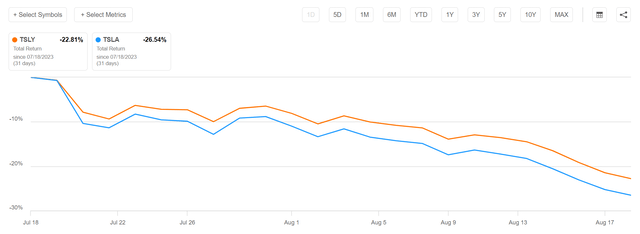
Is Shortened Call Writing A Change In Strategy Or A Response To Changing Market Dynamics?
One notable and subtle change in TSLY’s portfolio is the writing of weekly TSLA call options, as shown with 08/23/23 and 08/25/23 expiries in Figure 4. While TSLY’s strategy, as stated in the prospectus, allows the fund to write call options with expiries one-month or less, I believe the fund had historically written monthly options when I last reviewed the fund’s strategy. So the move to weekly options constitutes a subtle shift in TSLY’s strategy.
Perhaps TSLY’s change to weekly options is simply in response to changing market dynamics, which has seen an explosion of option trading volumes in stock options with expiries as short as 1 day. By many estimates, 0DTE options (options with zero days to expiry), now contribute over 40% of all option volumes daily (Figure 7), with some days surpassing 50% (Figure 8).
Figure 7 – 0DTE options gaining popularity (Bloomberg)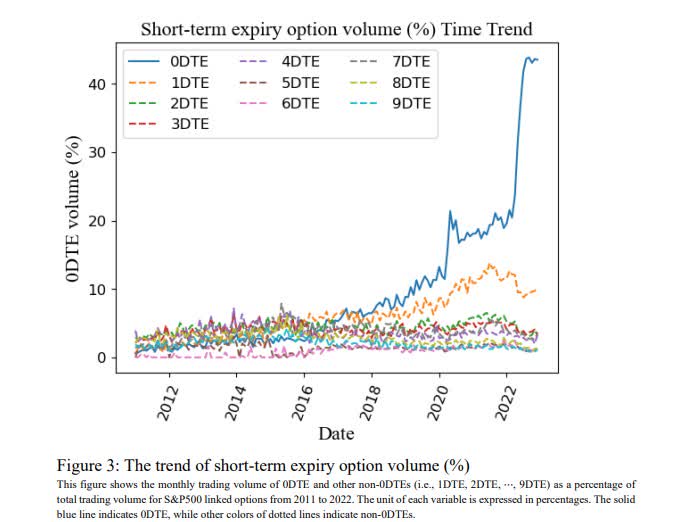
Figure 8 – With 0DTE options accounting for over 50% of total option trading volumes on some days (Goldman Sachs data via spotgamma.com’s twitter feed)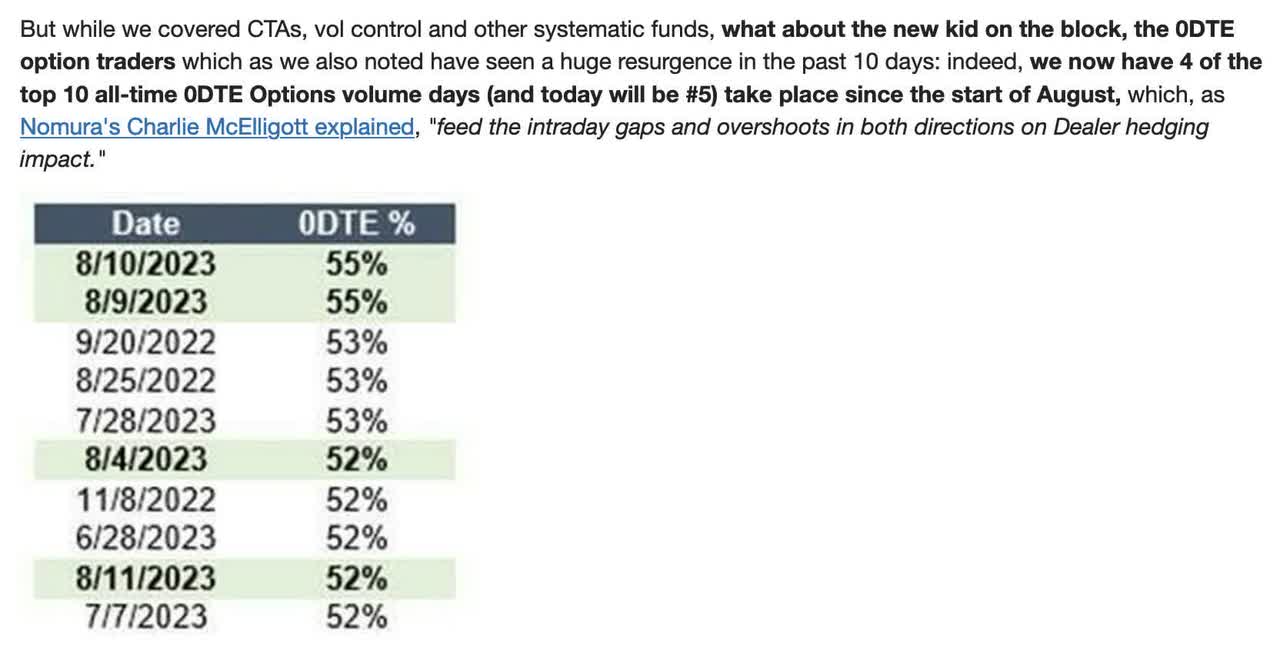
But this change in TSLY’s strategy may introduce additional costs and risks that are not yet fully known. For example, whereas before, the TSLY incurs trading fees once a month to write monthly options, now it will have to incur them several times a week to write weekly options.
Also, writing monthly options allow the option seller to earn one month of ‘theta decay’, as the option marches towards expiry. It is unclear whether the cumulative theta from writing multiple weekly options will be equivalent to the theta from a monthly option, since weekly options avoids some weekend days (i.e. writing a Friday option on a Monday, for example).
On the other hand, shorter-dated options tend to trade at higher implied volatilities (“IV”, a measure of price for options), so it may be advantageous to write a series of weekly call options versus writing a monthly call (Figure 9).
Figure 9 – Comparison of IV between TSLA call options at $225 strike expiring August 25th vs. September 15th (Author created with data from barcharts.com)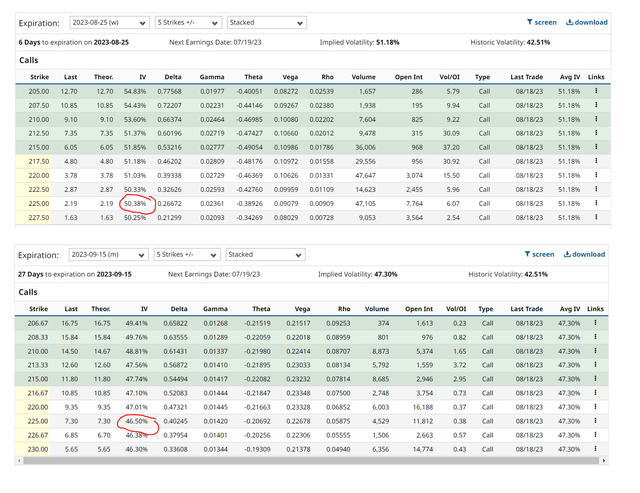
Suffice to say that the area of weekly and daily options are still relatively new and their behaviours and risks are not fully known at this point.
Pair TSLY Against Short TSLA; Is This Reasonable Advice?
Since my article, I have seen other analysts chime in with their takes on the TSLY ETF. Most simply gush over TSLY’s high yield, but some have proposed pairing the TSLY ETF with a short position in TSLA shares.
I believe this is a very dangerous strategy that investors should think hard about before employing. Recall from above, the TSLY ETF basically holds a synthetic long position in TSLA stock while writing covered calls. If the investor pairs TSLY with a short TSLA position, then they effectively become naked short calls on TSLA stock.
Given the extreme volatility of TSLA shares, being naked short calls could be a recipe for disaster. Consider the following monthly returns distribution of TSLA shares, reproduced from my prior article (Figure 10). We can see that TSLA have had some extreme 1-month moves, with 49 out of 155 months (31% of the time) having returns greater than 10%, which means a strategy of being short 1-month 10% OTM calls will lose money in those situations.
Figure 10 – TSLA monthly returns histogram (Author created with data from Yahoo Finance)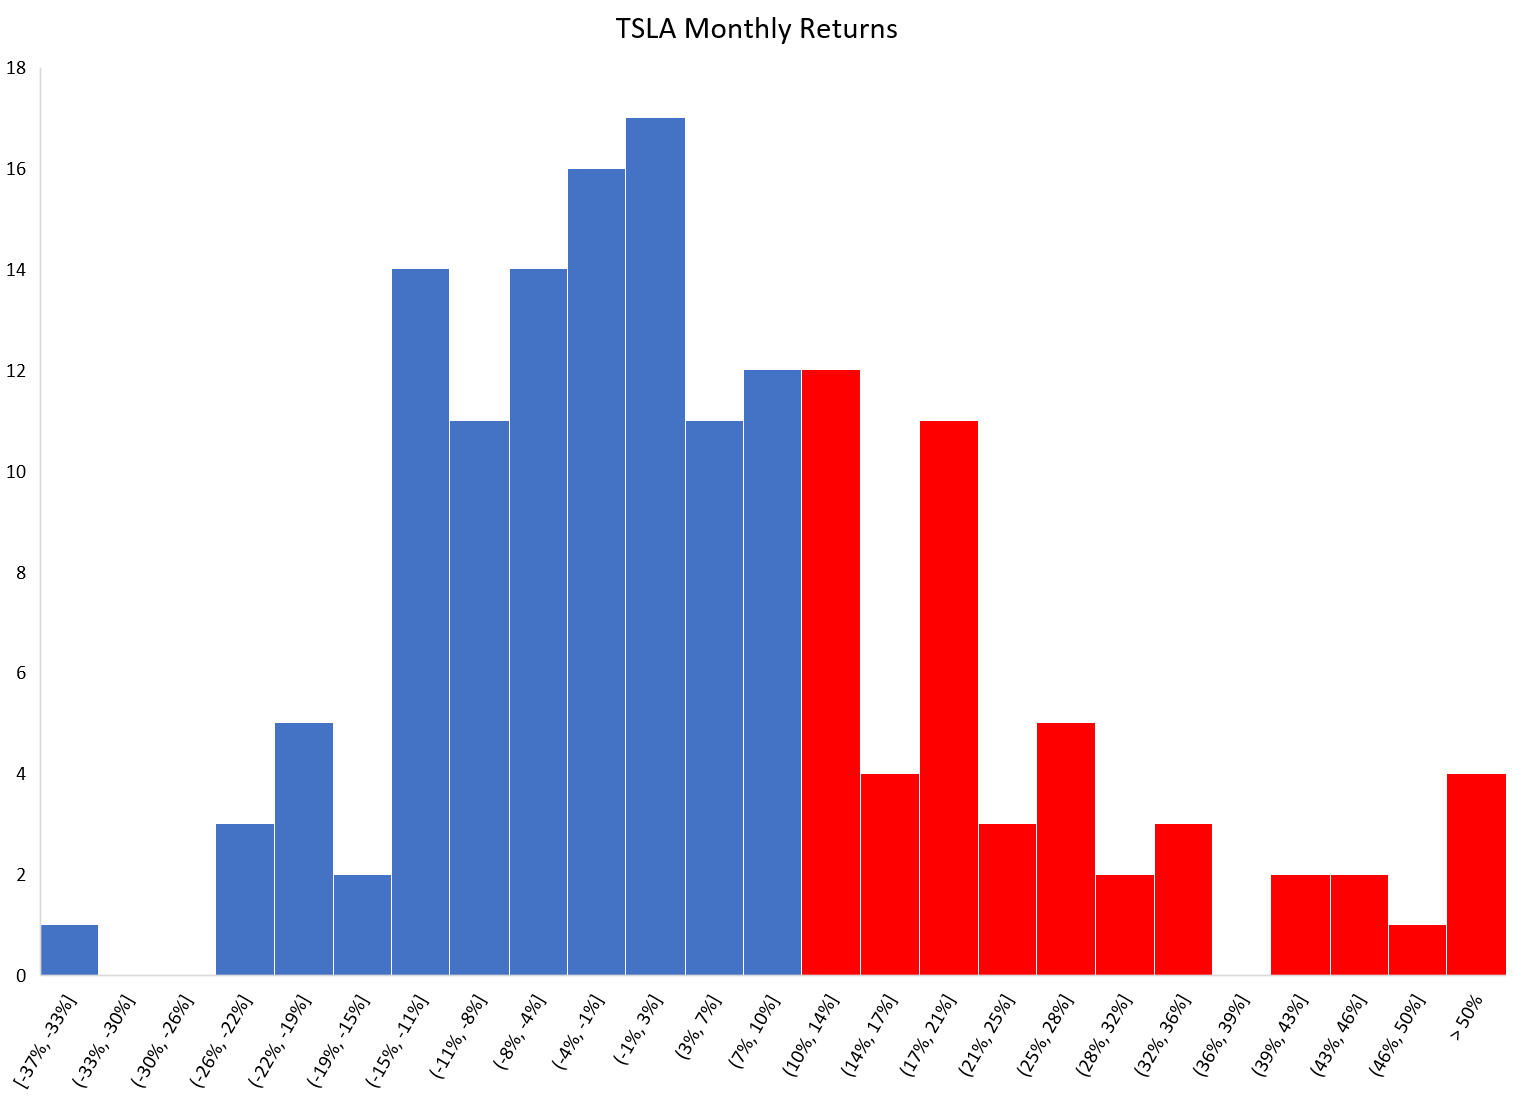
The losses can sometimes be very dramatic. For example, notice that there are 12 instances in Figure 10 where TSLA shares have rallied more than 32% in a single month. If investors were short 10% OTM calls in those instances, they may end up losing 22% or more!
Furthermore, TSLA can go on epic multi-month rallies, including a recent 170% rally from January lows to July peaks (Figure ).
Figure 11 – TSLA shares rallied 170% from January to July 2023 (Seeking Alpha)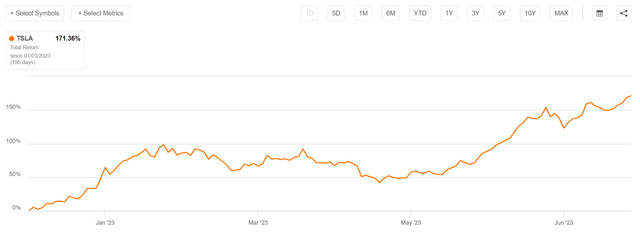
A strategy of shorting calls (Long TSLY / Short TSLA), if timed incorrectly to coincide with such a rally, could cause catastrophic losses month after month for investors.
Conclusion
In conclusion, I continue to believe highly volatile investment funds like the TSLY ETF should be avoided for conservative income-oriented investors. While the headline yield is very attractive, it does not represent the total returns that can be expected from investing in the TSLY ETF. There is no free lunch in financial markets.
Credit: Source link