
• bitcoinBitcoin(BTC)$79,964.000.38%
  • ethereumEthereum(ETH)$2,497.101.75%
  • tetherTether(USDT)$1.00-0.02%
  • binancecoinBNB(BNB)$765.745.89%
  • rippleXRP(XRP)$1.421.25%
  • usd-coinUSDC(USDC)$1.000.00%
  • solanaSolana(SOL)$103.721.63%
  • tronTRON(TRX)$0.3342000.74%
  • Figure HelocFigure Heloc(FIGR_HELOC)$1.061.66%
  • HyperliquidHyperliquid(HYPE)$86.112.21%
  • zcashZcash(ZEC)$1,075.055.37%
  • dogecoinDogecoin(DOGE)$0.0906566.75%
  • RainRain(RAIN)$0.0170623.73%
  • moneroMonero(XMR)$554.915.00%
  • USDSUSDS(USDS)$1.000.00%
  • chainlinkChainlink(LINK)$12.285.33%
  • whitebitWhiteBIT Coin(WBT)$73.720.74%
  • leo-tokenLEO Token(LEO)$9.23-0.05%
  • cardanoCardano(ADA)$0.2220355.17%
  • stellarStellar(XLM)$0.1853333.23%
  • bitcoin-cashBitcoin Cash(BCH)$258.334.87%
  • daiDai(DAI)$1.000.01%
  • uniswapUniswap(UNI)$7.3418.72%
  • CantonCanton(CC)$0.1103452.45%
  • Ethena USDeEthena USDe(USDE)$1.00-0.01%
  • USD1USD1(USD1)$1.000.00%
  • litecoinLitecoin(LTC)$54.515.87%
  • the-open-networkGram (prev. Toncoin)(GRAM)$1.432.18%
  • hedera-hashgraphHedera(HBAR)$0.0810122.50%
  • avalanche-2Avalanche(AVAX)$7.673.67%
  • suiSui(SUI)$0.814.64%
  • Global DollarGlobal Dollar(USDG)$1.00-0.01%
  • shiba-inuShiba Inu(SHIB)$0.0000054.87%
  • paypal-usdPayPal USD(PYUSD)$1.00-0.01%
  • nearNEAR Protocol(NEAR)$2.21-0.65%
  • BlackRock USD Institutional Digital Liquidity FundBlackRock USD Institutional Digital Liquidity Fund(BUIDL)$1.000.00%
  • crypto-com-chainCronos(CRO)$0.0570612.10%
  • tether-goldTether Gold(XAUT)$4,424.63-0.15%
  • Circle USYCCircle USYC(USYC)$1.140.00%
  • MemeCoreMemeCore(M)$1.130.04%
  • okbOKB(OKB)$115.605.50%
  • Ripple USDRipple USD(RLUSD)$1.00-0.01%
  • BittensorBittensor(TAO)$237.884.91%
  • Ondo US Dollar YieldOndo US Dollar Yield(USDY)$1.140.31%
  • AsterAster(ASTER)$0.807.72%
  • aaveAave(AAVE)$138.335.92%
  • mantleMantle(MNT)$0.593.05%
  • pax-goldPAX Gold(PAXG)$4,431.38-0.11%
  • EthenaEthena(ENA)$0.18705614.45%
  • OndoOndo(ONDO)$0.3774273.53%
TradePoint.io
  • Main
  • AI & Technology
  • Stock Charts
  • Market & News
  • Business
  • Finance Tips
  • Trade Tube
  • Blog
  • Shop
No Result
View All Result
TradePoint.io
No Result
View All Result

WDI: A Compelling Combination In This 12%-Yielding CEF

August 16, 2023
in Market & News
Reading Time: 6 mins read
A A
WDI: A Compelling Combination In This 12%-Yielding CEF
ShareShareShareShareShare

Darren415

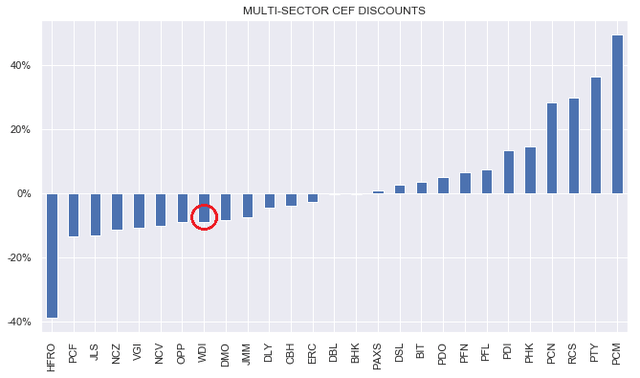
In this article, we provide an update on the Western Asset Diversified Income Fund (NYSE:WDI). The fund has continued to raise its distributions on the back of a substantial floating-rate asset base as well as stable borrowings. However, unlike bank loan funds, which have also enjoyed distribution hikes, WDI has a duration north of 5.0, which is a compelling feature given the high level of longer-term yields as well as the potential drop in yields if the macro picture worsens. WDI trades at a 12.1% current yield and a 9.1% discount.

YOU MAY ALSO LIKE

Deadly flooding hits Eastern U.S., Bertha impacts Texas

Emmy Awards Night 1 Winners List (Updating Live) – Deadline

Fund Snapshot

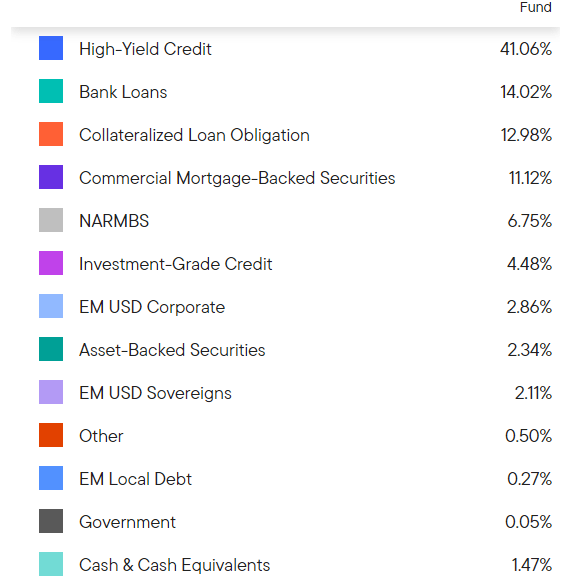
WDI is a multi-sector credit fund. About half of the portfolio is allocated to corporate bonds, primarily to high-yield (i.e. sub investment-grade) corporates.

The rest of the portfolio is allocated to mortgage-related securities (both residential and commercial) as well as bank loans and CLOs, most of which are floating-rate.
Western Asset

Western Asset

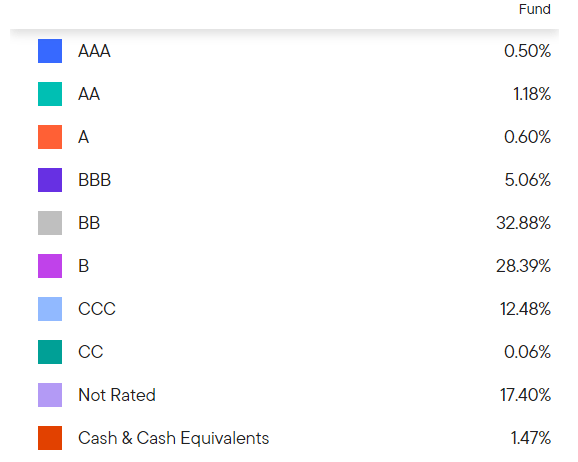
The fund’s credit exposure is firmly in the sub investment-grade space. That said, it’s not quite bottom-of-the-barrel, as CCC and below-rated exposure is just 12.5%.
Western Asset

Western Asset

Income Profile

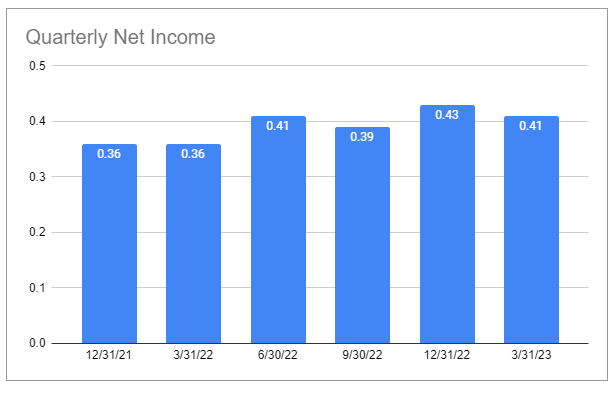
The net income of WDI is positively geared to higher short-term rates. This is because about half its assets are floating-rate, primarily bank loans, CLOs and CMOs. Specifically, roughly $594m (of $1.1bn) of its total assets are floating-rate. Relative to its $378m of floating-rate borrowings, that leaves $216m of net floating-rate assets, or about 29% of the NAV. In other words, for each 1% of rise in short-term rates, net income rises by around 0.3%.

We can see the steady (if a bit noisy) increase in its quarterly net income in the chart below. As short-term rates have flat-lined somewhat, we shouldn’t expect a big push higher in net income, however.
Systematic Income CEF Tool

Systematic Income CEF Tool

Another positive support of the fund’s net income is the fact that its borrowings have increased from the start of 2022. This is in contrast to many CEFs having had to deleverage, creating a headwind to net income. Its ability to add borrowings is a function of its relatively low level of leverage in 2022, its relative NAV stability, as well as its sizable floating-rate asset base.

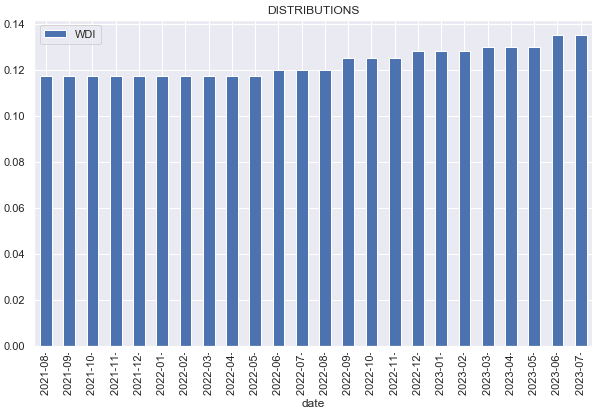
All of this translated into a steady hiking regime, with the fund recently making its sixth distribution increase since inception in mid-2021. It’s worth noting that UNII also increased from $0.03 to $0.22 over the same period. This is the best regular distribution performance in the sector and across nearly all but pure bank loan CEFs. The chart below does not capture the latest hike to $0.14.
Systematic Income

Systematic Income

On paper the fund’s distribution coverage is around 98%, however, in reality it’s very likely to be well north of 100% as the latest net income figure we have is from Q1 and short-term rates have increased by around 0.8% since then.

Valuation Profile

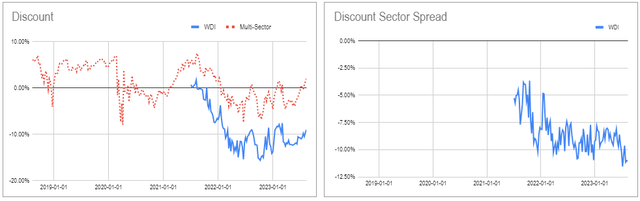
The market continues to ignore WDI despite its relative outperformance since inception and its history of distribution hikes.

The chart below shows its discount (blue line) relative to other multi-sector CEFs (red line). Here we see that the fund’s discount remains wider of the sector average, with the differential close to a record wide level.
Systematic Income CEF Tool

Systematic Income CEF Tool

Arguably, one reason for that is the sharp rally in PIMCO CEFs, six of which are trading at double-digit premiums. However, even in the broader sector, its discount is on the wider side.
In this article we provide an update on the Western Asset Diversified Income Fund (<a href=

Systematic Income

Takeaways

WDI remains an attractive option in the broader credit CEF space. It has a combination of a significant floating-rate base as well as a relatively long duration profile – both attractive in the current environment. The fund continues to trade at a relatively wide discount versus other multi-sector CEFs and remains in our Income Portfolios.

Check out Systematic Income and explore our Income Portfolios, engineered with both yield and risk management considerations.

Use our powerful Interactive Investor Tools to navigate the BDC, CEF, OEF, preferred and baby bond markets.

Read our Investor Guides: to CEFs, Preferreds and PIMCO CEFs.

Check us out on a no-risk basis – sign up for a 2-week free trial!

Credit: Source link

ShareTweetSendSharePin

Related Posts

Deadly flooding hits Eastern U.S., Bertha impacts Texas
Market & News

Deadly flooding hits Eastern U.S., Bertha impacts Texas

September 6, 2026
Emmy Awards Night 1 Winners List (Updating Live) – Deadline
Market & News

Emmy Awards Night 1 Winners List (Updating Live) – Deadline

September 6, 2026
Stay Tuned NOW Streaming Behind The Scenes! – Jul 23
Market & News

Stay Tuned NOW Streaming Behind The Scenes! – Jul 23

September 6, 2026
N.Y. Gov. Hochul on the AI Data Center Moratorium; Plus, Living in ‘Data Center Alley’ – July 23
Market & News

N.Y. Gov. Hochul on the AI Data Center Moratorium; Plus, Living in ‘Data Center Alley’ – July 23

September 6, 2026
Next Post
Adobe Express Enhances User Experience With Firefly Generative AI

Adobe Express Enhances User Experience With Firefly Generative AI

Leave a Reply Cancel reply

Your email address will not be published. Required fields are marked *

Search

No Result
View All Result
Google DeepMind Releases Gemini 3.8 Flash and Gemini 3.8 Flash Cyber: One Core Model, Two Access Envelopes

Google DeepMind Releases Gemini 3.8 Flash and Gemini 3.8 Flash Cyber: One Core Model, Two Access Envelopes

September 2, 2026
What’s Actually Worth Buying Over Labor Day – and What to Skip

What’s Actually Worth Buying Over Labor Day – and What to Skip

August 31, 2026
DICK'S Sporting Goods: A 31% Selloff Was Too Much

DICK'S Sporting Goods: A 31% Selloff Was Too Much

August 31, 2026

About

Learn more

Our Services

Legal

Privacy Policy

Terms of Use

Bloggers

Learn more

Article Links

Contact

Advertise

Ask us anything

©2020- TradePoint.io - All rights reserved!

Tradepoint.io, being just a publishing and technology platform, is not a registered broker-dealer or investment adviser. So we do not provide investment advice. Rather, brokerage services are provided to clients of Tradepoint.io by independent SEC-registered broker-dealers and members of FINRA/SIPC. Every form of investing carries some risk and past performance is not a guarantee of future results. “Tradepoint.io“, “Instant Investing” and “My Trading Tools” are registered trademarks of Apperbuild, LLC.

This website is operated by Apperbuild, LLC. We have no link to any brokerage firm and we do not provide investment advice. Every information and resource we provide is solely for the education of our readers. © 2020 Apperbuild, LLC. All rights reserved.

No Result
View All Result
  • Main
  • AI & Technology
  • Stock Charts
  • Market & News
  • Business
  • Finance Tips
  • Trade Tube
  • Blog
  • Shop

© 2023 - TradePoint.io - All Rights Reserved!