

boonstudio/iStock via Getty Images
Invesco S&P Ultra Dividend Revenue ETF (NYSEARCA:RDIV) is a value-heavy high-turnover dividend fund I previously covered in October 2021; back then, it earned a Hold rating from me. Today’s note is supposed to provide an update on its portfolio composition, discuss its performance, and elaborate on why I am against buying into RDIV right now despite its phenomenally strong value characteristics that should theoretically be beneficial amid the tech/growth rally losing steam.
According to its website, RDIV tracks the S&P 900 Dividend Revenue-Weighted Index. In fact, this is a peculiar smart beta strategy designed to identify relatively safe U.S. mid- and large-cap dividend plays and then increase value exposure of the resulting mix by using the sales factor in weighting.
The index has a notably labyrinthine methodology that can be divided into roughly four steps described in its fact sheet.
- First, with the S&P 900 being the selection universe, the index provider removes the 5% of securities with the highest dividend yields; I believe this rule serves as a simple anti-value trap screen.
- Next, the top 5% of securities within each sector with the highest payout ratios (hence, theoretically more prone to a DPS cut or outright elimination in the near term) are also filtered out.
- In step 3, 60 securities with the highest dividend yields are selected; they are re-weighted in step 4, with those with larger revenues having subsequently larger allocations, and vice versa, with a 5% single company cap.
The index is reconstituted and rebalanced every quarter, so small wonder the fund’s turnover is at 110%.
As of August 11, RDIV had a portfolio of 60 companies, with the top sectors being financials (26.9%), materials (16.3%), and consumer discretionary (12.2%). The table below contains the data for the key ten holdings I believe to be the most relevant. Please pay attention to EPS and revenue growth rates as they are telling; we will return to that issue shortly.
| Company | Ticker | Weight | Sector | Market Cap ($ billion) | EY | P/S | Revenue FWD | EPS FWD | ROE | DY |
| LyondellBasell Industries NV | (LYB) | 5.5% | Materials | 32.1 | 7% | 0.75 | -4.95% | -15.52% | 16.63% | 4.86% |
| Dow Inc | (DOW) | 5.3% | Materials | 38.9 | 4% | 0.80 | -5.38% | -24.03% | 9.17% | 5.05% |
| Intel Corp | (INTC) | 5.3% | Information Technology | 146.1 | -1% | 2.68 | -7.78% | -31.35% | -0.91% | 2.81% |
| US Bancorp | (USB) | 5.1% | Financials | 61.4 | 9% | 2.48 | 7.57% | -5.18% | 11.35% | 4.87% |
| 3M Co | (MMM) | 5.1% | Industrials | 57.7 | -3% | 1.76 | -2.31% | -1.33% | -13.37% | 5.72% |
| Philip Morris International Inc | (PM) | 4.9% | Consumer Staples | 149.3 | 5% | 4.50 | 6.89% | 4.08% | NM | 5.28% |
| Citigroup Inc | (C) | 4.7% | Financials | 85.8 | 16% | 1.22 | 3.48% | -14.94% | 6.68% | 4.62% |
| Best Buy Co Inc | (BBY) | 4.7% | Consumer Discretionary | 17.8 | 7% | 0.39 | -4.95% | -11.93% | 47.55% | 4.54% |
| Paramount Global | (PARA) | 4.5% | Communication Services | 10.1 | -12% | 0.33 | 3.95% | -27% | -6.35% | 5.04% |
| Duke Energy Corp | (DUK) | 4.4% | Utilities | 72.3 | 2% | 2.53 | 5.33% | 4.46% | 7.34% | 4.28% |
Created using data from Seeking Alpha and the fund
As weights can obviously inch a bit higher or drift lower between quarterly reconstitutions/rebalancing, RDIV has five holdings with weights above the 5% target, with LYB, one of the top names in the commodity chemicals industry, being the most notable one (5.5%).
As the methodology is rather picky and nuanced, with frequent reconstitutions, it is hardly a coincidence that only about 19% of its current holdings were present in the October 2021 version that I analyzed in the previous note. These changes might look fundamental, but they have not impacted one major advantage of RDIV, namely its permanently phenomenal value characteristics. As I discussed in a few of my notes recently, momentum in growthier stocks is disappearing slowly but steadily, and preparing for the inevitable correction is necessary. Hence, value should be back in vogue. A good starting point is RDIV’s weighted-average dividend yield, which is at 4.88% as per my calculations, mostly driven by such names as Advance Auto Parts (AAP), Truist Financial Corporation (TFC), and Foot Locker (FL), which, in turn, have seen their DYs surging amid utterly lackluster share price performance this year.
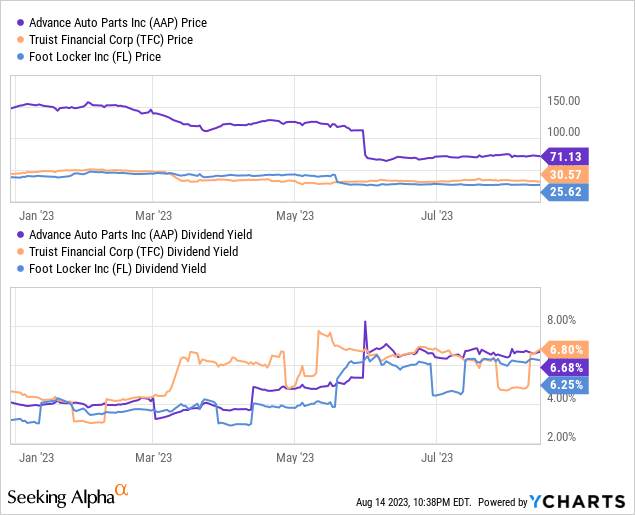
Unfortunately, this is something to tolerate in the value stock arena, as an appealing yield is frequently the direct result of a company falling out of favor with investors.
Besides, please note that the weighted-average dividend yield of the portfolio and RDIV’s LTM dividend yield are different; the latter is currently at 3.98%.
Obviously, the earnings yield would add much more informative context, and the fact is, it stands at 4.9%. A nuance here is that eight loss-making names like UGI Corporation (UGI) detract from it, but with their impact nullified for modeling purposes, the yield would edge straight to 6.9%, a nice result for a mix with a weighted-average market cap of $44.2 billion. My calculations also show a Price/Sales ratio of 1.9x, which is again supportive of the value thesis. And most importantly, RDIV remains one of the top ETFs in the universe I cover regarding the share of stocks with attractive Quant Valuation grades (B- or better), which was over 82% as of August 11 (it was close to 91% as of the October 2021 note).
Another interesting issue here is that the relative inexpensiveness of the RDIV portfolio is not directly tied to poor-quality holdings. Contrarily, we see over 81% of the companies having a B- or higher Quant Profitability grade, which is a respectable result. But there is something to criticize as well. We see a 22% weighted-average Return on Equity, a figure certainly nothing short of robust, but the problem here is Iron Mountain’s (IRM) contribution, which has an abnormal ROE close to 61%, mostly the consequence of its ~2,703% Debt/Equity ratio. Another notable contributors are debt-heavy BBY and Lamar Advertising Company (LAMR). So, at just 6.7%, ROA already does not look that strong.
But obviously, a mid-single-digit ROA is not the key reason why I am skeptical about RDIV. The top culprit is its outright lackluster growth characteristics. First, I found out that its weighted-average revenue growth rate is only 1.3%. But this is just the tip of the iceberg. Earnings contraction looks like a much more worrisome factor as the WA forward rate is negative 9.4%, mostly because close to 77% of the holdings are forecast to deliver lower EPS going forward; as the table above illustrates, pundits think 8 out of 10 key companies will be unable to increase EPS going forward. I believe this is unacceptable.
A Brief Performance Discussion
Incepted in September 2013, RDIV was reorganized in May 2019 after Invesco (IVZ) acquired OppenheimerFunds from MassMutual. For that reason, I would prefer to analyze its performance over the June 2019 – July 2023 period. The funds selected for comparison are the iShares Core S&P 500 ETF (IVV) and SPDR S&P MIDCAP 400 ETF Trust (MDY).
| Portfolio | IVV | RDIV | MDY |
| Initial Balance | $10,000 | $10,000 | $10,000 |
| Final Balance | $17,856 | $14,064 | $15,874 |
| CAGR | 14.93% | 8.53% | 11.73% |
| Stdev | 18.80% | 26.70% | 22.51% |
| Best Year | 28.76% | 27.93% | 24.21% |
| Worst Year | -18.16% | -10.37% | -13.28% |
| Max. Drawdown | -23.93% | -40.38% | -29.63% |
| Sharpe Ratio | 0.76 | 0.39 | 0.54 |
| Sortino Ratio | 1.18 | 0.56 | 0.81 |
| Market Correlation | 1 | 0.81 | 0.94 |
Created using data from Portfolio Visualizer
Even though RDIV showed resilience last year, with 2021 also being rather robust as it outperformed MDY, its annualized return over the period concerned is hardly appealing, partly because it suffered a decline of over 10% in 2020. Also, in the first seven months of 2023, it was down by 1.8%, while both the S&P 400 and S&P 500 funds were up in double digits. An over 40% max drawdown (during the coronavirus-driven market sell-off in 2020) is also telling.
Final Thoughts
Investors on the hunt for reliable dividend plays would likely find RDIV’s 3.98% yielding concentrated portfolio worth buying into, especially because of its rather strong quality discussed above. Unfortunately, there are two key downsides that make an otherwise solid value ETF unappealing: its triple-digit turnover and lackluster growth characteristics. RDIV’s dividend- and value-centered strategy is potent, no doubt, as it secured a 7.1% total return last year while IVV and MDY were deeply in the red. But with 77% of the holdings having negative forecast EPS growth rates, RDIV remains a Hold at best.
Credit: Source link