
Don White/E+ via Getty Images
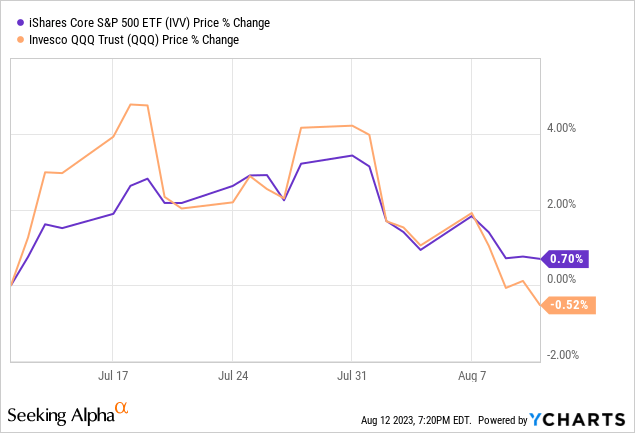
In the July article on the Alpha Architect U.S. Quantitative Value ETF (QVAL) I pointed out that the growth rotation might have been losing steam and that increasing exposure to better-valued equity mixes was something to consider. And in fact, nothing has changed about this hypothesis. So the markets are chugging along despite harbingers of disinflation ultimately ending as the fresh Producer Price Index reading has illustrated, but the early signs of tiredness are already clearly visible in the iShares Core S&P 500 ETF’s (IVV) and Invesco QQQ ETF’s (QQQ) one-month performance.
Also, while the S&P 500 index is down by 1.7%, QVAL has risen by 3.9% since July 22.
Seeking Alpha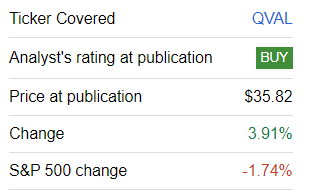
So, as solid excesses have been amassed this year in the growth stock echelon, disproportionately large exposure to growth-heavy plays implies elevated risks.
However, there are interesting growth funds that also offer quality and even value exposure. A good example is the Janus Henderson Small Cap Growth Alpha ETF (NASDAQ:JSML), an ETF with an earnings yield of around 7.3%, as per my calculations, despite its focus on growthier small-cap names. Today, I would like to review its portfolio and past performance to answer the question about whether its factor mix makes it adequately prepared for a potential deeper correction.
Discussing the strategy and the portfolio
JSML was incepted in February 2016. As described on the JSML website, its underlying index is the Janus Henderson Small Cap Growth Alpha Index, which is rebalanced quarterly. According to the strategy discussion in the prospectus, constituents are drawn from the Solactive Small Cap Index.
The idea at the foundation of the index is to leverage a proprietary quantitative methodology to whittle the list of eligible names down to “stocks that are poised for sustainable growth,” as the fact sheet put it. For that purpose, growth, profitability, and capital efficiency are measured using 10 fundamental factors. Among the metrics on this list are return on invested capital, margin expansion, and revenue growth rates. Those that ended up in the top 10% with the strongest scores are market-cap-weighted. Interestingly, there is an active ingredient in the strategy as well, since
the stocks are sector-weighted to reflect the sector allocation weight of Janus Henderson Venture Fund, based on its most recent publicly available holdings.
In the current iteration, the product of this strategy is a portfolio of 179 stocks. The ETF is overweight in industrials, healthcare, and information technology. At the same time, it allocated only about 69 bps to real estate, while utilities are completely absent. This is in sharp contrast to the iShares Russell 2000 Growth ETF (IWO), which tracks the index JSML compares its performance to. Notably, IWO has a 6.4% smaller allocation to industrials and a 4.6% larger allocation to consumer discretionary. It also has about 1.6% deployed to utilities.
Created using data from JSML, IWO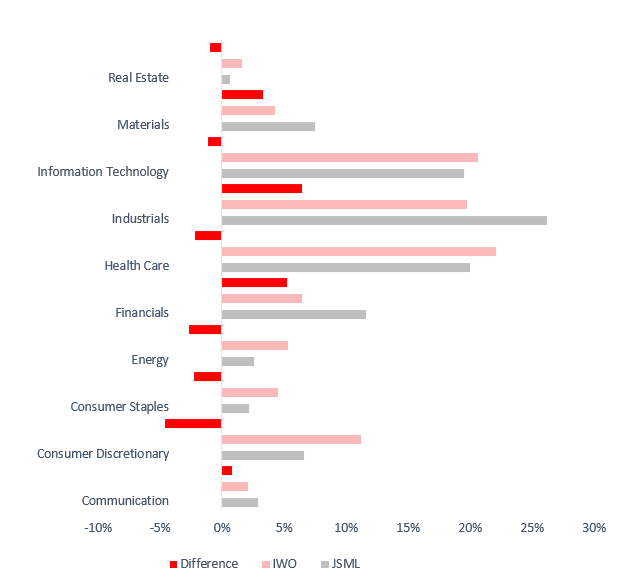
Now, there are a few questions we should answer. First, regarding value. Does JSML offer adequate valuation characteristics? And surprisingly, it does, but with nuances.
This ETF has a typical small-cap problem: it is overweight in medium-size stocks. As my calculations based on the data as of August 10 illustrate, JSML had a weighted-average market cap of $3.1 billion, a figure mostly influenced by 68% of the holdings with a market value above $2 billion. However, even despite that, we still see a rather strong 7.3% earnings yield. Delving deeper, the result is primarily supported by financials, materials, and energy, with the key contributors being Callon Petroleum (CPE) and Alpha Metallurgical Resources (AMR), with yields of around 40% and 36.8%, respectively. Regarding Callon, it is worth briefly noting that its record net margin, bolstered by the oil price recovery and soaring revenues, should edge lower this year as analysts are expecting a more than 51% decline in EPS, so its FY2023 EY is just around 19%.
However, the EY is just the tip of the iceberg, and looking at the Quant Valuation grades for a better understanding of risks certainly makes sense. And though the Quant grades do not speak outright against buying into the JSML equity mix, they do not look fully supportive either as ~41% of the holdings are comparatively overvalued (a D+ grade or lower) while only ~38% are priced relatively attractively (B- grade or higher).
Next, growth. Here, JSML has something to be justly proud of, though vulnerabilities also do exist, as usual. My calculations show the WA EPS forward growth rate at 10.3%. However, about 24% of the companies are forecast to deliver EPS contraction. Sales growth looks robust portfolio-wise (12.1%), but ~12.6% of the holdings are still anticipated to report lower revenues going forward.
Ultimately, quality. As I mentioned above, eligible securities are screened for those with strong ROIC among other things. But instead of ROIC, I would like to take a closer look at Return on Assets, Return on Invested Capital, and Return on Equity. All three figures look fine. Besides, the share of stocks with a B- Quant Profitability grade is comparatively large at 77.8%, but I would personally prefer a result at least in the high eighties.
| ROE | ROA | ROTC |
| 19.6% | 9.7% | 10.31% |
Calculated using data from Seeking Alpha and the fund
The table below combines the principal fundamental metrics for the top ten holdings.
| Company | Weight | Sector | Market Cap ($ billion) | EY | P/S | EV/EBITDA | Revenue FWD | Return on Equity | Return on Total Capital |
| Amphastar Pharmaceuticals, Inc. (AMPH) | 3.18% | Health Care | 3.04 | 3.4% | 5.57 | 21.06 | 21.56% | 18.73% | 9.85% |
| MP Materials Corp Class (AMP) | 3.04% | Materials | 4.08 | 4.3% | 10.75 | 19.16 | 19.86% | 13.81% | 5.14% |
| Amkor Technology, Inc. (AMKR) | 3.00% | Information Technology | 6.67 | 8.7% | 0.96 | 5.16 | 4.95% | 16.59% | 8.91% |
| Progyny, Inc. (PGNY) | 2.88% | Health Care | 3.72 | 1.3% | 3.81 | 74.17 | 37.37% | 12.63% | 6.92% |
| Allegro MicroSystems, Inc. (ALGM) | 2.84% | Information Technology | 7.84 | 3% | 7.54 | 24.30 | 15.36% | 26.59% | 17.07% |
| Badger Meter, Inc. (BMI) | 2.34% | Information Technology | 4.75 | 1.6% | 7.52 | 36.23 | 13.81% | 17.35% | 13.90% |
| Fabrinet (FN) | 2.23% | Information Technology | 4.52 | 5.4% | 1.77 | 13.57 | 13.47% | 18.22% | 11.58% |
| STAAR Surgical Company (STAA) | 2.15% | Health Care | 2.2 | 1.1% | 7.16 | 65.20 | 18.19% | 7.62% | 4.58% |
| AdaptHealth Corp. (AHCO) | 2.10% | Health Care | 1.99 | 2.2% | 0.65 | 7.30 | 11.29% | 2.19% | 2.72% |
| Alpha Metallurgical Resources, Inc. (AMR) | 2.05% | Materials | 2.51 | 36.8% | 0.83 | 1.90 | 4.07% | 64.14% | 43.43% |
Created using data from Seeking Alpha and the fund as of August 10
Performance
JSML’s performance story is rather nuanced. On the back of the soft landing and fading inflation narratives, this ETF delivered a blockbuster total return in the first 7 months of 2023, rising by 30.4%, heftily beating IVV and IWO, though still underperforming growth- and tech-heavy QQQ which was up by 44.5%. However, there is a much more complex story beneath the surface.
For example, last year, it suffered dearly as it underperformed both IWO and IVV, finishing only marginally ahead of QQQ. Also, it had a completely lackluster 2021 as it was unable to benefit from the value rotation and eked out an about 3% gain, a meager result slightly ahead of the Russell 2000 Growth ETF that rose by 2.5%; the iShares Russell 2000 ETF (IWN), a small/mid-cap echelon barometer, delivered a 14.5% total return. Both QQQ and IVV were up in the high twenties.
Overall, with these soft periods factored in, JSML’s longer-term returns look much weaker compared to the S&P 500 fund, let alone QQQ, even though IWO’s performance was much bleaker. Over the March 2016 – July 2023 period, it did outperform IWO and IWN, yet failed to outcompete the market and the Nasdaq 100 cohort. It is also worth noting that it had the deepest drawdown in the group and the highest standard deviation to boot.
| Portfolio | IVV | JSML | IWO | QQQ | IWN |
| Initial Balance | $10,000 | $10,000 | $10,000 | $10,000 | $10,000 |
| Final Balance | $27,148 | $24,276 | $21,692 | $39,652 | $21,350 |
| CAGR | 14.41% | 12.70% | 11.01% | 20.41% | 10.77% |
| Stdev | 15.97% | 23.12% | 21.05% | 19.37% | 20.90% |
| Best Year | 31.25% | 35.38% | 34.68% | 48.40% | 33.31% |
| Worst Year | -18.16% | -29.40% | -26.26% | -32.58% | -20.48% |
| Max. Drawdown | -23.93% | -36.16% | -33.55% | -32.58% | -32.29% |
| Sharpe Ratio | 0.84 | 0.57 | 0.54 | 0.99 | 0.53 |
| Sortino Ratio | 1.29 | 0.89 | 0.8 | 1.62 | 0.79 |
| Market Correlation | 1 | 0.89 | 0.91 | 0.9 | 0.91 |
Created using data from Portfolio Visualizer
Investor Takeaway
In sum, JSML is a passively managed fund offering exposure to a portfolio of mostly medium-sized, high-quality U.S. stocks demonstrating robust growth characteristics. The expense ratio is modest at 30 bps despite the complex strategy.
I was initially optimistic about the concept, but after delving deeper into the factor analysis, I became more skeptical about JSML. The reality is that the fund is not a small-cap one, as the equity mix is dominated by mid caps. Its returns in 2023 are solid, but its longer-term performance is less impressive. Factor story beneath the surface did not appeal to me, even though there is a surprising slight value tilt. For these reasons, any rating above Hold would be unjustified in my view.
Credit: Source link