

sankai
Dividend investors prefer companies with a track record of increasing their dividends, as they usually perform better than those without. When a company increases its dividend, it usually signifies a robust business performance and a dedication to rewarding its shareholders. As someone who closely observes these companies, I’m happy to provide you with the most recent information about upcoming dividend increases. I have compiled useful lists that offer valuable insights into the stocks expected to increase dividends in the coming week. This information is handy even as inflation has decreased since its highs.
This list is a trimmed-down version, only covering dividend increases. A full upcoming dividend calendar is always available here.
How I Created The Lists
The following information results from combining the “U.S. Dividend Champions” spreadsheet on this website with upcoming dividend data from NASDAQ. This process involves merging data on companies with a history of dividend growth with their future dividend payments. It is important to note that all companies included in this list have at least five years of consistent dividend growth.
Companies are required to have higher total dividends paid out each year. Therefore, a company may not raise its dividend each calendar year, but the total annual dividend can still increase.
What Is The Ex-Dividend Date?
The ex-dividend date marks the eligibility cut-off point for the upcoming dividend or distribution. To qualify, you must have purchased shares by the close of the preceding business day. For example, if the ex-dividend date falls on a Tuesday, you must have bought (or already owned) the shares by the market close on Monday. Note that if the ex-dividend date is on a Monday (or a Tuesday if Monday is a holiday), you must have acquired the shares by the prior Friday.
Dividend Streak Categories
Here are the definitions of the streak categories, as I’ll use them throughout the piece.
- King: 50+ years.
- Champion/Aristocrat: 25+ years.
- Contender: 10-24 years.
- Challenger: 5+ years.
| Category | Count |
| King | 2 |
| Champion | 3 |
| Contender | 10 |
| Challenger | 2 |
The Dividend Increasers List
Data has been sorted by the ex-dividend day (ascending) and then by the streak (descending):
| Name | Ticker | Streak | Forward Yield | Ex-Div Date | Increase Percent | Streak Category |
| American States Water Company | (AWR) | 69 | 1.95 | 14-Aug-23 | 8.04% | King |
| Cintas Corporation | (CTAS) | 39 | 1.1 | 14-Aug-23 | 17.39% | Champion |
| Kroger Company | (KR) | 17 | 2.35 | 14-Aug-23 | 11.54% | Contender |
| Reinsurance Group of America, Incorporated | (RGA) | 14 | 2.46 | 14-Aug-23 | 6.25% | Contender |
| Arbor Realty Trust | (ABR) | 11 | 10.41 | 14-Aug-23 | 2.38% | Contender |
| Target Corporation | (TGT) | 56 | 3.37 | 15-Aug-23 | 1.85% | King |
| Carlisle Companies Incorporated | (CSL) | 47 | 1.19 | 16-Aug-23 | 13.33% | Champion |
| Lindsay Corporation | (LNN) | 21 | 1.08 | 16-Aug-23 | 2.94% | Contender |
| ResMed Inc. | (RMD) | 11 | 1.09 | 16-Aug-23 | 9.09% | Contender |
| Comfort Systems USA, Inc. | (FIX) | 11 | 0.51 | 16-Aug-23 | 12.50% | Contender |
| J.M. Smucker Company | (SJM) | 26 | 2.86 | 17-Aug-23 | 3.92% | Champion |
| Duke Energy Corporation (Holding Company) | (DUK) | 19 | 4.42 | 17-Aug-23 | 1.99% | Contender |
| Hawkins, Inc. | (HWKN) | 19 | 1.27 | 17-Aug-23 | 6.67% | Contender |
| The Hershey Company | (HSY) | 14 | 2.11 | 17-Aug-23 | 15.06% | Contender |
| Hercules Capital, Inc. | (HTGC) | 6 | 9.36 | 17-Aug-23 | 2.13% | Challenger |
| Wingstop Inc. | (WING) | 6 | 0.54 | 17-Aug-23 | 15.79% | Challenger |
| Ryder System, Inc. | (R) | 19 | 2.79 | 18-Aug-23 | 14.52% | Contender |
Field Definitions
Streak: Years of dividend growth history are sourced from the U.S. Dividend Champions spreadsheet.
Forward Yield: The new payout rate is divided by the current share price.
Ex-Dividend Date: This is the date you need to own the stock.
Increase Percent: The percent increase.
Streak Category: This is the overall dividend history classification of the company.
Show Me The Money
Here’s a table mapping the new rates versus the old rates. It also reiterates the percentage increase. This table is sorted similarly to the first (ex-dividend day ascending, dividend streak descending).
| Ticker | Old Rate | New Rate | Increase Percent |
| AWR | 0.398 | 0.43 | 8.04% |
| CTAS | 1.15 | 1.35 | 17.39% |
| KR | 0.26 | 0.29 | 11.54% |
| RGA | 0.8 | 0.85 | 6.25% |
| ABR | 0.42 | 0.43 | 2.38% |
| TGT | 1.08 | 1.1 | 1.85% |
| CSL | 0.75 | 0.85 | 13.33% |
| LNN | 0.34 | 0.35 | 2.94% |
| FIX | 0.2 | 0.225 | 12.50% |
| RMD | 0.44 | 0.48 | 9.09% |
| SJM | 1.02 | 1.06 | 3.92% |
| DUK | 1.005 | 1.025 | 1.99% |
| HWKN | 0.15 | 0.16 | 6.67% |
| HSY | 1.036 | 1.192 | 15.06% |
| WING | 0.19 | 0.22 | 15.79% |
| HTGC | 0.47 | 0.48 | 2.13% |
| R | 0.62 | 0.71 | 14.52% |
Additional Metrics
Some different metrics related to these companies include yearly pricing action and the P/E ratio. The table is sorted the same way as the table above. A value investor may find stock ideas with those companies near their 52-week lows, as they could provide more margin of safety and inflated yield.
| Ticker | Current Price | 52 Week Low | 52 Week High | PE Ratio | % Off Low | % Off High |
| AWR | 88.19 | 76.91 | 99.64 | 33.24 | 15% Off Low | 11% Off High |
| CTAS | 492.3 | 367.23 | 518.71 | 41.26 | 34% Off Low | 5% Off High |
| KR | 49.27 | 41.12 | 51.14 | 8.18 | 20% Off Low | 4% Off High |
| RGA | 138.3 | 118.29 | 151.77 | 15.19 | 17% Off Low | 9% Off High |
| ABR | 16.52 | 9.77 | 17.74 | 15 | 69% Off Low | 7% Off High |
| TGT | 130.61 | 125.08 | 179.35 | 22.91 | 4% Off Low | 27% Off High |
| CSL | 285.13 | 202.94 | 314.95 | 23.6 | 40% Off Low | 9% Off High |
| LNN | 129.87 | 110.43 | 182.17 | 33.49 | 18% Off Low | 29% Off High |
| FIX | 177.26 | 94.92 | 182.94 | 13.39 | 87% Off Low | 3% Off High |
| RMD | 176.94 | 176.14 | 245.73 | 44.87 | 0% Off Low | 28% Off High |
| SJM | 148.12 | 128.74 | 160.91 | 15.17 | 15% Off Low | 8% Off High |
| HWKN | 50.32 | 36.19 | 53 | 16.9 | 39% Off Low | 5% Off High |
| DUK | 92.83 | 81.23 | 110.24 | 33.6 | 14% Off Low | 16% Off High |
| HSY | 225.71 | 208.78 | 275.81 | 26.27 | 8% Off Low | 18% Off High |
| WING | 163.05 | 107.76 | 223.35 | 112.38 | 51% Off Low | 27% Off High |
| HTGC | 17.09 | 10.55 | 18.05 | 12.73 | 62% Off Low | 5% Off High |
| R | 101.79 | 64.33 | 103.81 | 0 | 58% Off Low | 2% Off High |
Tickers By Yield And Growth Rates
I have arranged the table in descending order for investors to prioritize the current yield. As a bonus, the table also features some historical dividend growth rates. Moreover, I have incorporated the “Chowder Rule,” which is the sum of the current yield and the five-year dividend growth rate.
| Ticker | Yield | 1 Yr DG | 3 Yr DG | 5 Yr DG | 10 Yr DG | Chowder Rule |
| HTGC | 9.36 | 13.8 | 5.2 | 3.8 | 4.1 | 13.2 |
| DUK | 4.42 | 2 | 2.1 | 2.5 | 2.8 | 7 |
| TGT | 3.37 | 20 | 17.9 | 11.7 | 11.6 | 15.1 |
| SJM | 2.86 | 3 | 5.1 | 5.5 | 7 | 8.4 |
| R | 2.79 | 6.9 | 3.5 | 4.8 | 7.2 | 7.6 |
| RGA | 2.46 | 9.6 | 4.6 | 9.9 | 12.8 | 12.3 |
| KR | 2.35 | 23.8 | 17.6 | 15.8 | 13.9 | 18.2 |
| HSY | 2.11 | 15 | 10.3 | 9.6 | 9.7 | 11.7 |
| AWR | 1.95 | 8.9 | 9.2 | 9.3 | 8.4 | 11.3 |
| HWKN | 1.27 | 7.4 | 7.8 | 5.7 | 5.5 | 7 |
| CSL | 1.19 | 38.9 | 14.5 | 15.2 | 14.1 | 16.4 |
| CTAS | 1.1 | 21.1 | 21.7 | 23.2 | 21.8 | 24.3 |
| RMD | 1.09 | 4.8 | 4.1 | 4.7 | 10 | 5.8 |
| LNN | 1.08 | 3 | 2.9 | 2.5 | 11.5 | 3.6 |
| ABR | 10.41 | 37.7 | 19.1 | 19.4 | 16.2 | 29.8 |
| WING | 0.54 | 11.8 | 20 | 22.1 | 22.7 | |
| FIX | 0.51 | 27.9 | 17.5 | 16.9 | 12.8 | 17.4 |
Historical Returns
As an investor, I focus on identifying stocks with consistent dividend growth and a track record of outperforming the market. I use the Schwab U.S. Dividend Equity ETF (SCHD) as a benchmark to gauge their performance. This ETF has a remarkable history of exceptional performance, a higher yield than the S&P 500, and a proven record of growing dividends. If you can’t beat the benchmark, you should take it instead. I use this analysis myself, as I’ve added both CTAS and FIX to my portfolio in past years.
Here’s the total return chart of SCHD versus the ten with the highest 10-year dividend growth history. There are quite a few standouts on this list; the aforementioned CTAS and FIX are nearly up 2000% each in the past decade. ABR has been another stellar outperformed with a 1260% return. Yet another great group of stocks in CSL, RMD, KR, and HSY are beating SCHD. Quite an impressive list of companies.
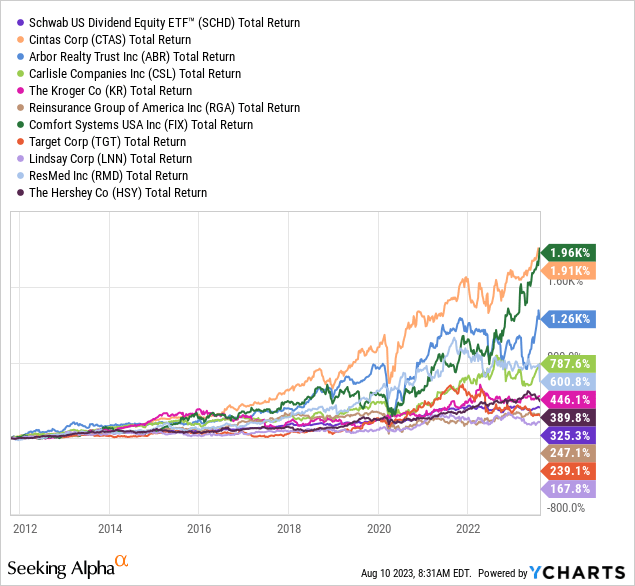
It looks like I have some extra homework to do this week! Please do your due diligence before investing, and thanks for reading.
Editor’s Note: This article discusses one or more securities that do not trade on a major U.S. exchange. Please be aware of the risks associated with these stocks.
Credit: Source link