

Galeanu Mihai
Quality Stocks
Following a strong finish to the first half of the year, my watchlist kicks off the last 6 months with a strong showing. The watchlist for July posted a strong gain of 5.36%, outpacing both the Vanguard Dividend Appreciation Index Fund ETF Shares (VIG) and the SPDR S&P 500 ETF Trust (SPY). Year-to-date, my watchlist is up 18.52%, compared to 10.55% for VIG and 20.62% for SPY.
While SPY continues to outpace my watchlist this year, since inception, the watchlist maintains a respectable level of alpha. The long-term, 35-month, annualized return for my watchlist is 15.98% compared to 10.73% for VIG and 11.45% for SPY.
My goal is not to beat SPY or VIG but to generate a long-term rate of return of at least 12%. Thus far, the watchlist is achieving this goal with nearly 3 years of history under its belt.
The main focus of this watchlist is to find the best combination of quality companies trading for attractive prices. I believe this is the optimal long-term strategy to build wealth.
The top 15 dividend growth stocks for August offer an average dividend yield of 1.58%. Collectively, they have increased dividend payments at a rate of 30.55% during the last 5 years. Based on dividend yield theory, these 15 stocks are about 32% undervalued right now, and I think they are poised to offer strong long-term returns.
I would recommend two approaches to dividend investing. The first is to dollar-cost average into at least 10-20 or more quality dividend-paying stocks across multiple sectors and industries. By dollar-cost averaging, you eliminate the risk of trying to value a stock and over a long enough period, theoretically, you will buy shares at market highs, lows, and in-between resulting in an average cost basis somewhere in the middle. The second method carries a little more risk. Invest in undervalued stocks, also dollar-cost averaging into at least 10-20 unique quality companies across multiple sectors and industries. The additional risk with this approach comes from the chance that your valuation method proves to be incorrect. However, by investing in multiple unique stocks, the odds that you accurately identify at least a few undervalued stocks increases. The resulting upside from a few correct picks may more than offset the underperformance from the bad ones.
Watchlist Criteria
The criteria used to determine which stocks are included in my high-growth dividend stock watchlist remains unchanged for August 2023. It is made up of the 8 factors listed below that have historically outperformed the broad universe of dividend-paying stocks when analyzed collectively.
- Market Cap of at least $10 billion.
- Payout Ratio no greater than 70%.
- 5-year Dividend Growth rate of at least 5%.
- 5-year Revenue Growth rate of at least 2%.
- 5-year EPS Growth rate of at least 2%.
- S&P Earnings and Dividend Rating of B+ or better.
- Wide or Narrow Moat (Morningstar).
- Exemplary or Standard Management Team (Morningstar).
The rules identified 132 stocks for the month that were all ranked based on the above-mentioned metrics with the exclusion of market cap. I then computed the current valuation for each stock using dividend yield theory. All stocks were ranked for both quality and valuation and sorted by the best combination of both. Next, I computed a forecasted rate of return for the next 5-year period for each of the stocks. This return is based on forecasted earnings growth, a return to fair value, and the dividend yield.
The highest-ranked 15 stocks with a forecasted return greater than or equal to 12% were chosen for the watchlist. The long-term hypothesis for this watchlist is that it will outperform a broad quality dividend fund such as Vanguard’s Dividend Appreciation ETF, VIG.
Watchlist For August 2023
Created by Author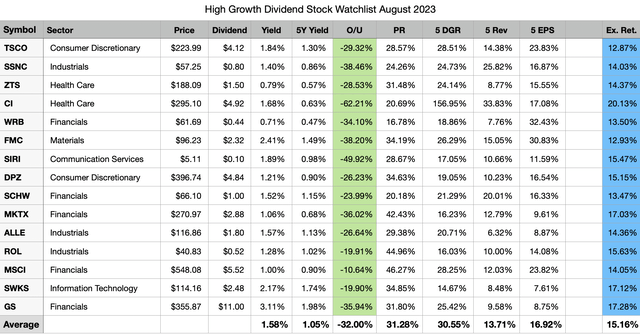
Above are the 15 stocks I am considering for further evaluation during the month. They are sorted in descending order by their rank and 5-year dividend growth rate.
The “O/U” column represents potential undervalue; this is a comparison of the current dividend yield to the historical dividend yield as a function of share price.
The expected return in the table above was computed using a discounted 5-year EPS forecast, a return to fair value, and the current dividend yield. There is also a margin of safety built into the forecasted return. These figures are just assumptions based on the available data and there is no guarantee these returns will be attained.
There are 3 changes to the top 15 list from the prior month. Dollar General (DG), Kroger (KR), and Microchip Technology (MCHP) have fallen further down the list, or do not meet the 12% expected rate of return threshold and were replaced by Goldman Sachs (GS), MarketAxess Holdings (MKTX), and Rollins (ROL).
Past Performance
The top 15 list for July posted a gain of 5.36% and sees its long-term alpha over both benchmarks improve. The long-term annualized rate of return for the watchlist increased from 14.35% last month to 15.98%. My target rate of return is 12%, and despite the volatility in the market this year, I remain optimistic that this watchlist will continue to exceed this goal in the long run.
|
Month |
Top 15 |
All |
VIG |
SPY |
|
1 Month |
5.36% |
4.67% |
2.35% |
3.27% |
|
3 Month |
8.91% |
8.74% |
6.02% |
10.47% |
|
6 Month |
8.30% |
6.88% |
7.43% |
13.48% |
|
1 Year |
18.25% |
11.60% |
10.75% |
12.95% |
|
2020 |
6.27% |
6.15% |
9.09% |
7.94% |
|
2021 |
33.81% |
31.55% |
23.75% |
28.76% |
|
2022 |
-8.58% |
-15.12% |
-9.80% |
-18.16% |
|
2023 |
18.52% |
15.05% |
10.55% |
20.62% |
|
Since Inception |
54.08% |
36.38% |
34.63% |
37.18% |
|
Annualized |
15.98% |
11.22% |
10.73% |
11.45% |
Top 5 past and present watchlist stocks in July 2023:
- U.S. Bancorp (USB) +20.10%
- Domino’s Pizza (DPZ) +17.73%
- MSCI (MSCI) +16.79%
- Charles Schwab (SCHW) +16.62%
- EOG Resources (EOG) +16.61%
Three of the top 15 stocks selected in July were amongst the top 5 past and present performing stocks last month; Domino’s Pizza, MSCI, and Charles Schwab. In total, there have been 72 unique dividend stocks selected by this watchlist since September of 2020.
Top 5 Stocks by Total Return since joining the watchlist:
- NVIDIA (NVDA) +251.57% (28 months).
- Automatic Data Processing (ADP) +89.01% (35 months).
- KLA Corporation (KLAC) +67.67% (27 months).
- Tractor Supply (TSCO) +64.19% (30 months).
- Cintas (CTAS) +61.71% (30 months).
Since not all stocks have been on the watchlist for the full 35 months of its existence, comparing a monthly average return can help normalize the results. Here are the top 5 stocks with the highest average monthly return since joining the watchlist.
- Microchip Technology +11.73% (2 months).
- NVIDIA +4.59% (28 months).
- EOG Resources +3.72% (5 months).
- Kroger +3.49% (1 month).
- Best Buy (BBY) +2.25% (13 months).
Drivers Of Alpha
The watchlist outperformed VIG in July. Ten watchlist stocks outpaced the ETF last month.
- (DPZ) +17.73%
- (MSCI) +16.79%
- (SCHW) +16.62%
- (SIRI) +12.58%
- (ZTS) +9.46%
- (CI) +5.17%
- (MCHP) +4.86%
- (WRB) +3.58%
- (KR) +3.49%
- (SWKS) +3.32%
The remaining 5 stocks underperformed VIG.
- (TSCO) +1.31%
- (DG) -0.19%
- (ALLE) -2.63%
- (SSNC) -3.88%
- (FMC) -7.77%
Total Return For All Watchlist Stocks
Here are the total returns for all past and present watchlist stocks since first appearing on the watchlist. Out of the 72 stocks that are on this list, 57 (51 last month) have positive total returns and 15 have negative total returns, the average return is 23.91% (19.01% last month). The watchlist has been around for 35 months, the average duration for all 72 stocks is 26.83 months.
|
Symbol |
Since Joining |
Count |
|
NVDA |
251.57% |
28 |
|
ADP |
89.01% |
35 |
|
KLAC |
67.67% |
27 |
|
TSCO |
64.19% |
30 |
|
CTAS |
61.71% |
30 |
|
AMAT |
60.14% |
30 |
|
UNH |
57.10% |
30 |
|
COST |
53.45% |
35 |
|
LRCX |
52.90% |
30 |
|
MSFT |
52.59% |
35 |
|
MPWR |
51.98% |
29 |
|
INTU |
50.98% |
35 |
|
MSCI |
50.38% |
35 |
|
PGR |
47.94% |
30 |
|
EXPD |
46.20% |
30 |
|
CDW |
46.09% |
30 |
|
APH |
45.04% |
30 |
|
LOW |
42.95% |
35 |
|
GGG |
41.62% |
35 |
|
TJX |
40.75% |
30 |
|
BK |
40.56% |
35 |
|
ACN |
37.40% |
35 |
|
NOC |
35.28% |
35 |
|
ROL |
34.90% |
18 |
|
BBY |
33.46% |
13 |
|
SCHW |
32.12% |
30 |
|
JPM |
31.80% |
30 |
|
WST |
30.50% |
35 |
|
FAST |
29.79% |
35 |
|
LMT |
29.18% |
35 |
|
CI |
27.28% |
17 |
|
BLK |
27.24% |
35 |
|
FDS |
27.20% |
35 |
|
DE |
27.06% |
20 |
|
HD |
25.69% |
35 |
|
FDX |
25.35% |
17 |
|
MCHP |
24.83% |
2 |
|
MCO |
22.86% |
35 |
|
SHW |
22.63% |
30 |
|
HUM |
22.41% |
29 |
|
TMO |
20.82% |
28 |
|
EOG |
20.03% |
5 |
|
CMCSA |
19.25% |
35 |
|
ROP |
17.36% |
35 |
|
TXN |
16.08% |
30 |
|
V |
14.32% |
35 |
|
ZTS |
14.14% |
6 |
|
USB |
13.53% |
33 |
|
MA |
11.88% |
35 |
|
MS |
8.36% |
26 |
|
ICE |
7.43% |
30 |
|
NTRS |
6.96% |
35 |
|
BX |
6.38% |
12 |
|
JKHY |
4.80% |
35 |
|
KR |
3.49% |
1 |
|
ATVI |
2.32% |
27 |
|
DPZ |
0.21% |
35 |
|
GS |
-0.14% |
24 |
|
WRB |
-0.72% |
4 |
|
TROW |
-0.78% |
35 |
|
ALLE |
-2.63% |
1 |
|
SSNC |
-9.71% |
29 |
|
SBUX |
-10.20% |
19 |
|
DG |
-14.94% |
28 |
|
LAD |
-19.35% |
28 |
|
FMC |
-19.52% |
14 |
|
SIRI |
-21.25% |
16 |
|
SWKS |
-23.77% |
19 |
|
BALL |
-37.83% |
19 |
|
MKTX |
-49.20% |
30 |
|
AAP |
-55.49% |
13 |
|
PARA |
-62.02% |
25 |
Dividend Analysis for New Stocks
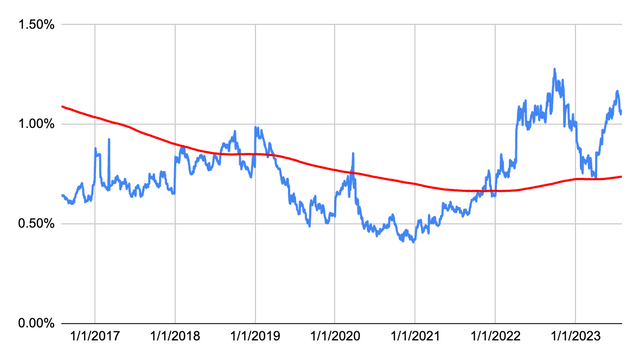
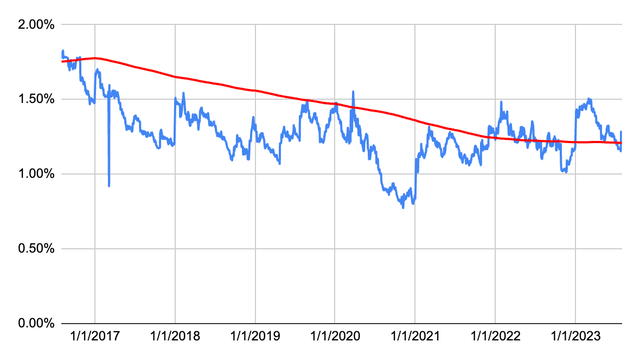
Below are a 7-year dividend yield theory chart, a dividend history chart, and dividend growth table for the 3 new stocks on the watchlist this month.
First up is Goldman Sachs.
Created by Author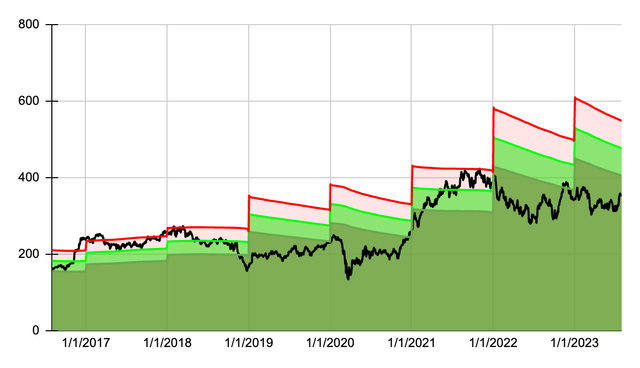
Created by Author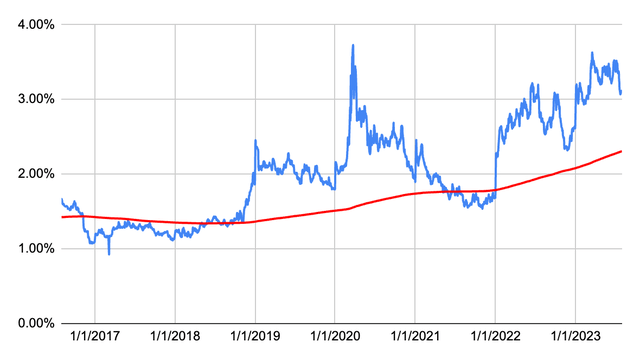
| Year | Dividend | Growth | CAGR |
| 2023 | 11.00 | 22.22% | |
| 2022 | 9.00 | 38.46% | 22.22% |
| 2021 | 6.50 | 30.00% | 30.09% |
| 2020 | 5.00 | 20.48% | 30.06% |
| 2019 | 4.15 | 31.75% | 27.60% |
| 2018 | 3.15 | 8.62% | 28.42% |
| 2017 | 2.90 | 11.54% | 24.88% |
| 2016 | 2.60 | 1.96% | 22.88% |
| 2015 | 2.55 | 13.33% | 20.05% |
| 2014 | 2.25 | 9.76% | 19.28% |
| 2013 | 2.05 | 15.82% | 18.29% |
| 2012 | 1.77 | 26.43% | 18.07% |
| 2011 | 1.40 | 18.74% |
Next up is MarketAxess Holdings
Created by Author Created by Author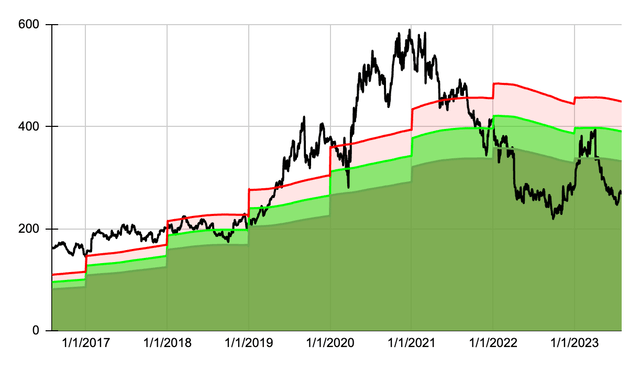
| Year | Dividend | Growth | CAGR |
| 2023 | 2.88 | 2.86% | |
| 2022 | 2.80 | 6.06% | 2.86% |
| 2021 | 2.64 | 10.00% | 4.45% |
| 2020 | 2.40 | 17.65% | 6.27% |
| 2019 | 2.04 | 21.43% | 9.00% |
| 2018 | 1.68 | 27.27% | 11.38% |
| 2017 | 1.32 | 26.92% | 13.89% |
| 2016 | 1.04 | 30.00% | 15.66% |
| 2015 | 0.80 | 25.00% | 17.36% |
| 2014 | 0.64 | 23.08% | 18.19% |
| 2013 | 0.52 | 18.18% | 18.67% |
| 2012 | 0.44 | 22.22% | 18.63% |
| 2011 | 0.36 | 18.92% |
And finally, we have Rollins.
Created by Author Created by Author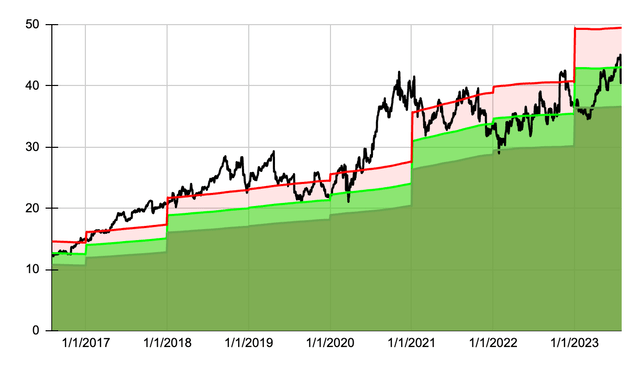
| Year | Dividend | Growth | CAGR |
| 2023 | 0.52 | 20.93% | |
| 2022 | 0.43 | 2.38% | 20.93% |
| 2021 | 0.42 | 28.56% | 11.27% |
| 2020 | 0.33 | 4.28% | 16.76% |
| 2019 | 0.31 | 0.71% | 13.50% |
| 2018 | 0.31 | 24.99% | 10.82% |
| 2017 | 0.25 | 12.02% | 13.07% |
| 2016 | 0.22 | 19.01% | 12.91% |
| 2015 | 0.19 | 21.16% | 13.66% |
| 2014 | 0.15 | 15.60% | 14.47% |
| 2013 | 0.13 | 2.22% | 14.58% |
| 2012 | 0.13 | 57.11% | 13.40% |
| 2011 | 0.08 | 16.52% |
Credit: Source link