Makhbubakhon Ismatova
If you are looking for small-cap exposure in a single fund, I modestly recommend CALF. The fund has a simple and straight-forward approach that should reduce risk and potentially increase future returns with the free cash flow yield factor. Let me explain…
The Problem With Small Caps
I love small caps. But I also hate small caps. The problem with smaller stocks is that they range from amazing to total garbage and it can be difficult to distinguish between the two. If you take an average of all small caps it looks like you are not properly compensated for the risk you assume. But what if you could filter out many of the over-priced and high-risk stocks with a simple filter?
- Try this: ensure the stock has positive free cash flow
Why is this a helpful filter? All too often, I hear about some small cap stock with an incredible story of possible growth and world domination IF IT CAN GAIN MARKET SHARE. But guess what? 99.9% of these stocks never do. These small caps are trading at sky-high valuations and they never take off. They burn through shareholder equity and dilute shares year after year to raise money to stay afloat. Don’t believe me?
The following chart shows the return of all small cap stocks with a liquidity filter which had negative free cash flow for the trailing 12 months and quarter.
portfolio123.com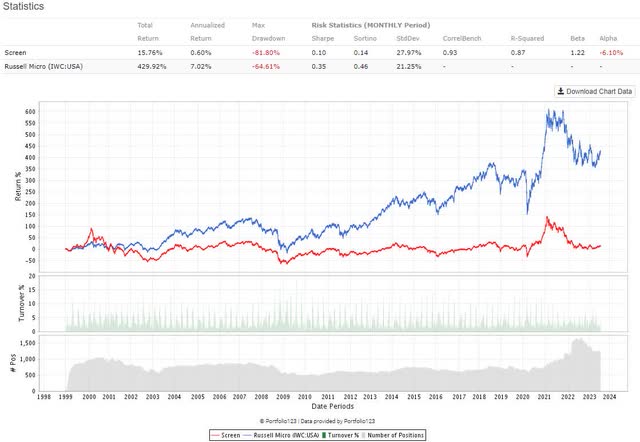
Since 1999, this group of negative free cash flow small cap stocks had a total return of 15.76% as opposed to 429.92% of the Russell Microcap Index ETF.
The Problem With CALF
The logic behind risk-reduction in small stocks using free cash flow is sound. But through my research, I have found that the larger and more well-known a company is, the less powerful this factor becomes. CALF uses the S&P 600 as its investment universe. While positive free cash flow still works to cut down on risk, it is not as profound as it could be.
In the following chart, I make a portfolio of S&P 600 stocks which have positive trailing free cash flow for the quarter and 12 months.
portfolio123.com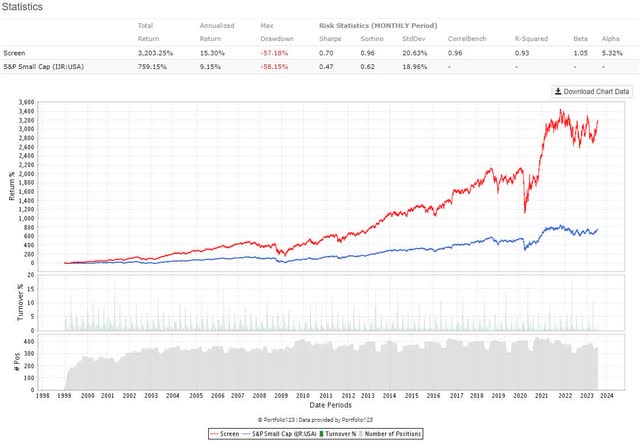
The returns are higher than the index but it would be much more pronounced in stocks outside the index. In addition to these stocks receiving more attention and coverage, they are also much larger than the classical definition of a small cap. Over one-third the index is mid-cap by most definitions. Still, you can see in the chart that positive free cash flow does work.
Analyzing the Free Cash Flow Yield Factor
But CALF doesn’t just screen out stocks with positive free cash flow. It focuses on the 100 stocks with the highest free cash flow yield. The formula is as follows:
- (Operating Cash Flow – CAPEX) / Enterprise Value
They use EV instead of market cap so that we are not fooled by companies with enormous amounts of debt boosting returns through leverage as having high free cash flow. EV includes cash and debt so that different capital structures can be compared more easily.
Using the tools at Portfolio123, I create a single factor ranking system of free cash flow divided by Enterprise Value. I create 6 portfolio sorts in the S&P 600 so that each portfolio represents 100 stocks. I then run this factor across the S&P 600 since 1999. The portfolios are re-sorted weekly as needed instead of quarterly as CALF does.
portfolio123.com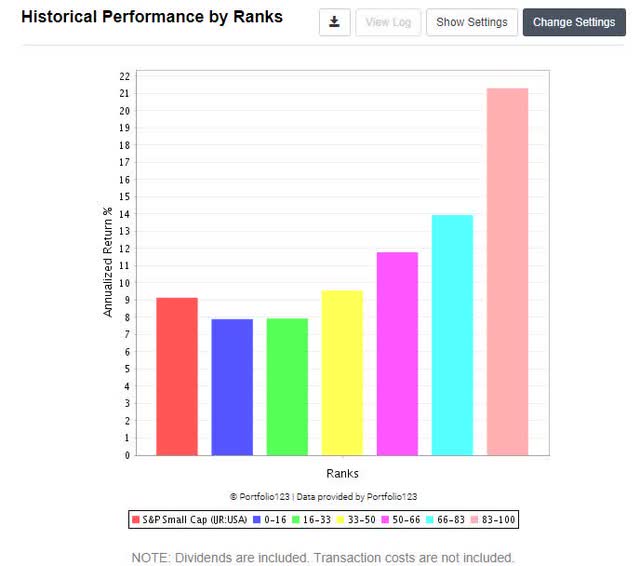
This chart shows the compounded annual growth rate of our benchmark and each sub-portfolio based on free cash flow yield. As you can see clearly, the stocks with the highest free cash flow yield have over 2.5x the return of the stocks with the lowest.
As a side note, the S&P 600 benchmark is so low compared to the other portfolios because it is cap-weighted and not equally-weighted. Thus, the return of the benchmark is not a simple average of the other portfolios. I usually get asked that so I will nip the question in the bud.
CALF Uses Forward Expectations Too
One of the problems with using free cash flow as a factor is that it can be volatile. When CAPEX is low, the yield is high. But when a one-time major expenditure is made, the free cash flow will plummet forcing the stock to be removed from the portfolio.
To reduce turnover, CALF screens S&P 600 stocks and removes any which have projected negative free cash flows over the next 2 years. This prevents the fund from buying companies which have a current high free cash flow yield but which is expected to turn negative.
Of course, many of these smaller stocks do not have any analyst forecasts on future free cash flows. CALF accommodates by allowing them in the final portfolio provided they have a high trailing free cash flow yield.
Weighting Scheme
The weighting scheme puts more emphasis on companies with higher total free cash flow. This will have the natural effect of tilting towards larger companies without using a market-cap weighting scheme. I tested this with my own research platform using FactSet data and the weighting scheme had very little effect. I give this a neutral rating for performance but a plus for fitting in with the style of the fund.
What I Would Do Different
Well-known funds have the problem of too much money. Berkshire is one example where the returns over the past 20 years has not been great and this is likely due to the huge cash pile they must invest. In contrast, small sums of money can be invested in a focused manner and moved around tactically as desired. Funds with massive amounts of AUM cannot do so. If I was running this as a private portfolio with a few million dollars – what would I do differently?
- Sector weighting – in my study of this strategy I found that sector weighting enhanced returns and lowered downside risk. I feel that sector risk is a problem with CALF and I wish they would have restricted it to a max of 15 – 20% per sector.
- Higher turnover – I realize that most investors want low turnover. But with free cash flow yield you are leaving a lot of money on the table with less frequent rebalancing. If free cash flow unexpectedly goes negative, you might wait up to 3 months to rotate into another stock. As FCF can be volatile, I would prefer to monitor this portfolio weekly and for sure every month at a minimum.
- Less positions – I would concentrate on the top 15 – 20 stocks.
- Equal-weight – I find that custom weighting schemes can really convolute unless there is a strong and compelling reason to do so.
This is a backtest for the CALF style strategy with my own customizations listed above. Of course, I would work to reduce turnover as positions are being held for 55 days on average only.
portfolio123.com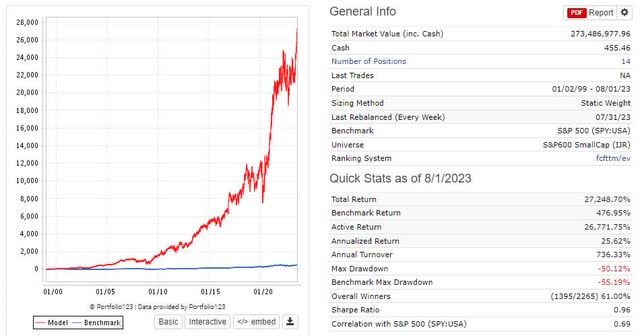
Final Thoughts
CALF is a reasonably good small cap ETF which reduces exposure to small story stocks with negative cashflows. It focuses on a yield metric which is close to my heart. But it also has the burden which all well-known ETFs have of massive AUM to invest. They are forced to employ techniques which dilute returns when compared to a private investor with the desire to do it themselves.
One possible approach for a DIY investor is to take the 100 stocks from the list of holdings and select the top 10 or 15 free cash flow yields for a more focused portfolio. And monitor it for any negative changes in free cash flow yield. A DIY investor should also balance the sectors.
In the end, I give CALF an enthusiastic one thumb up. It does as good as it can under the circumstances.
Credit: Source link