


ZE14361/iStock via Getty Images
If you’re looking for a high-yield investment that profits from rising interest rates, the business development company sub sector has benefited greatly from higher rates in this new era.
BDCs lend to privately-held companies, most of whom have co-sponsors with much larger stakes in these companies. Hence, there’s more security for the BDC investment, as the co-sponsors will offer support to the underlying companies during economic down cycles.
Company Profile:
As of 7/6/23, Owl Rock Capital (ORCC) was renamed Blue Owl Capital Corporation (NYSE:OBDC), in a rebranding which saw all of the Blue Owl Capital (OWL) BDC’s switching to the Blue Owl name. OWL has $144B in assets under management.
Blue Owl Capital Corp. is a specialty finance company focused on lending to U.S. upper middle-market companies. As of 3/31/23, the Company had investments in 187 portfolio companies with an aggregate fair value of $13.2B. 90% of its debt investments are sponsor-backed.
It’s the third largest BDC, with a market cap of $5.53B.
The Company has elected to be regulated as a business development company, BDC, under the Investment Company Act of 1940.
OBDC is externally managed by Blue Owl Credit Advisors LLC, an SEC-registered investment adviser that is an indirect affiliate of Blue Owl Capital Inc. It’s part of Blue Owl’s Credit platform, which focuses on direct lending. (OBDC site)
Holdings:
98.2% of OBDC’s debt investments are on floating rates, with 46% of its debt at fixed rates.
As of 3/31/23, the company’s $13.2B portfolio consisted of 70.5% first lien senior secured debt investments, 14.1% second lien senior secured debt investments, 2.0% unsecured debt investments, 2.4% investment funds and vehicles, 3.0% preferred equity investments, and 8.0% common equity investments. The average loan-to-value is 46%.
OBDC site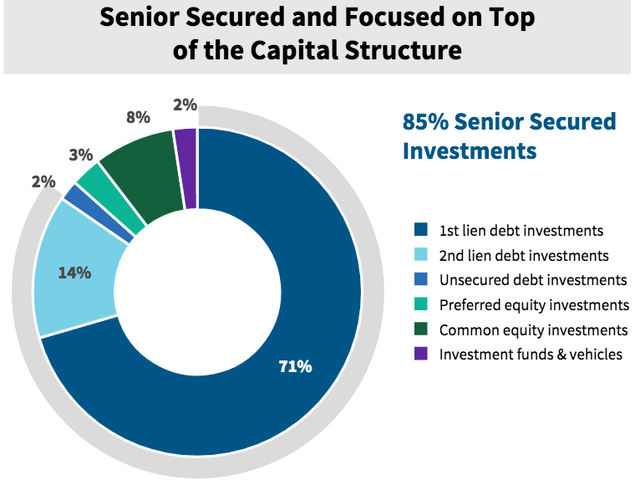
OBDC’s largest industry exposures are Internet Software & Services, at 14%; Insurance, at 10%; Food & Beverage, at 7%; and Manufacturing, at 6%. 36% of its portfolio is split between 19 other industries:
OBDC site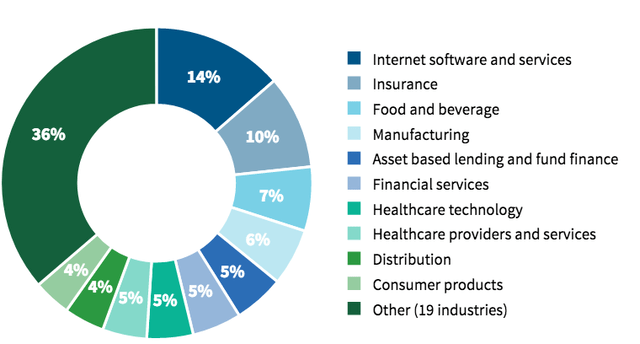
The weighted average total yield of accruing debt and income-producing securities at fair value (which includes interest income and amortization of fees and discounts) was 12%, as of 3/31/23.
OBDC’s size allows it to participate in large deals, which have been increasing over the past few years – there were more than 30 $1B+ deals publicly announced since 2020.
Portfolio Companies Ratings:
Like other BDCs, OBDC grades its invested companies quarterly. Management uses a scale of 1 (highest) to 5 (lowest). The overall average rating has been consistent over the past 4 quarters, at 2.0, with ~90% of these companies in the top 2 tiers.
Three investments in two portfolio companies were on non-accrual as of 3/31/23, representing ~0.5% of debt investments at cost. OBDC has an average annual loss rate of 15 basis points since its inception in 2016.
OBDC site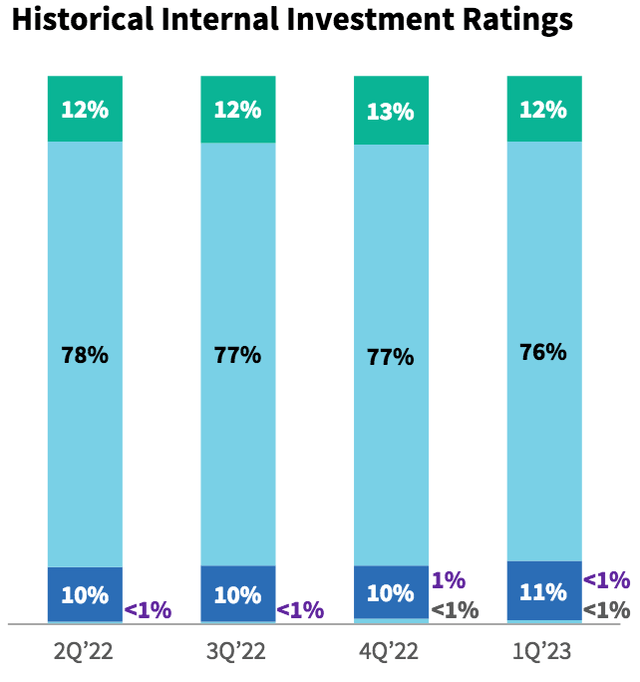
Earnings:
Q1 2023: This was a strong quarter for OBDC, with Total Investment & Other Income up 43%, and NII up ~45%, driven primarily by higher base rates on investments. NII/Share hit a company record of $.45.
As with most other companies, interest expense was way up, jumping 63%.
New investment commitments totaled $175.1M across three new portfolio companies and eight existing portfolio companies, vs. $211.2M for Q4 2022, across six new portfolio companies, and two existing portfolio companies.
The principal amount of new investments funded was $94.3M, with $76.1M in aggregate principal amount in sales and repayments.
NAV/Share was $15.15, up 1.8% vs. Q1 ’22.
2022: There was good topline growth of 17.7%, and NII and NII/share growth of ~13.6%. The share count was down slightly, while interest expense rose 40%.
Hidden Dividend Stocks Plus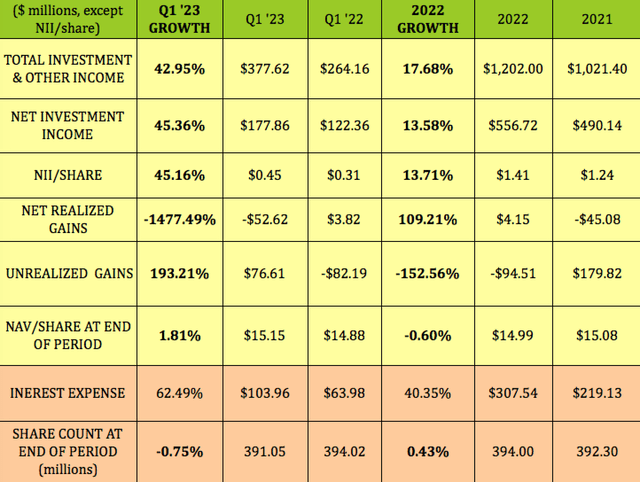
Industry Tailwinds:
Rising rates benefiting BDC’s, with dramatically higher rates vs. the 1st half of 2022. While the regional banking crisis caused those banks to do even less direct lending, this mainly benefits smaller BDC’s which lend to middle and lower middle market companies, whereas OBDC does much larger deals.
OBDC CEO Packer: “I think it’s probably the best environment we’ve seen since we were a public company for new investments. Spreads remain elevated. Base rates are obviously high. In addition, we’re getting very attractive OID upfront and higher-than-typical call premiums. So what does that mean? We’re getting 12% to 13% on unitranche vs. 7%, 7.5% a year ago.” (Q1 ’23 call)
Dividends:
Management increased the base quarterly payout from $.31 to $.33 in Q4 ’22. They paid a $.04 special distribution for Q4 ’22, and increased it to $.06 for Q1 ’23.
At its 7/28/23 $14.11 closing price, OBDC’s base dividend yield is 9.36%; the recent $.06 special payout adds 1.7%, for a potential total yield of 11.06%. OBDC should go ex-dividend next in late September, with a mid-November pay date.
Hidden Dividend Stocks Plus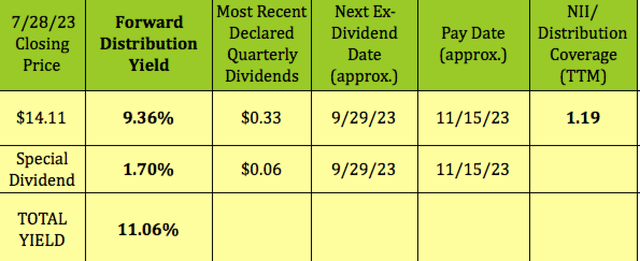
Regular dividend coverage has been steadily climbing over the past four quarters, reaching a very robust 1.36X for Q1 ’23, and averaging 1.19X on a ttm basis.
Adding on the $.13/share in special payouts shows a total trailing coverage factor of 1.08X.
Hidden Dividend Stocks Plus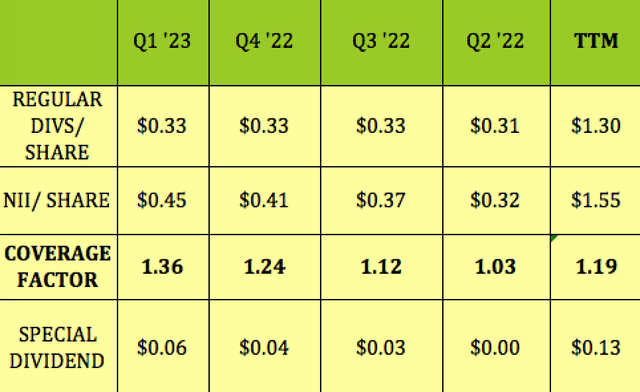
Profitability and Leverage:
While ROA and ROE dipped for full year ’22, they were back on track in Q1 ’23, with both figures and EBIT Margin above BDC industry averages.
Debt/NAV has been roughly steady, and is slightly lower than BDC averages, while net debt/EBIT has been decreasing a great deal, improving from 9.32X in Q4 ’21, all the way down to 7.22X in Q1 ’23:
Hidden Dividend Stocks Plus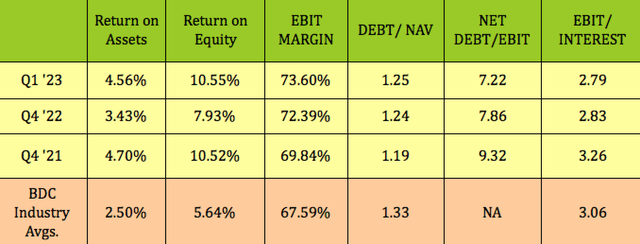
Debt and Liquidity:
OBDC has a $1.855B credit revolver, which may be increased to $2.8B. It matures in August 2027. It has ~$2.5B in financing from CLOs, which mature in 2013 – 2035. It also has a special purpose vehicle facility, SPV, of $350M, which matures in December 2029.
OBDC had $1.7 billion of cash and undrawn debt capacity, as of 3/31/23.
Its next debt maturity is in April 2024, when $460M in Senior Notes comes due, representing 6.2% of debt.
OBDC site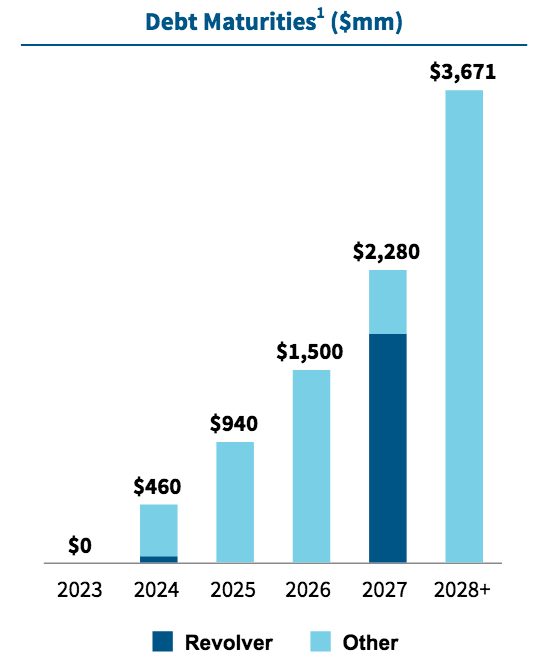
OBDC has Investment grade/Stable ratings from four agencies:
OBDC site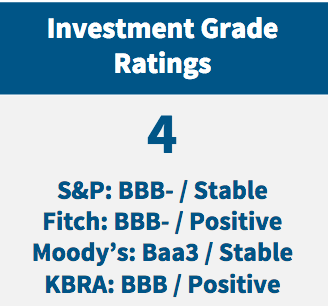
Performance:
OBDC has outperformed the BDC industry and the broad financial sector by wide margins in 2023 on a price basis, and has also outperformed both on a one-year total return basis.
It has also outperformed the S&P 500 so far in 2023, and over the past year on a total return basis.
Hidden Dividend Stocks Plus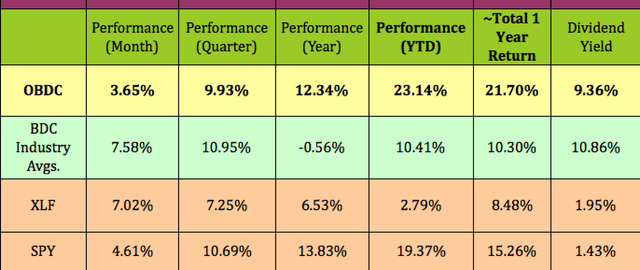
Analysts’ Upgrades and Price Targets:
OBDC just received an initial BUY rating from B. Riley on 7/28/23, with a $15.25 price target, 8% higher than its 7/28/23 closing price.
At $14.11, OBDC is 5.6% below Wall Street analysts’ average price target of $14.94, and ~12% below their $16.00 highest price target.
Hidden Dividend Stocks Plus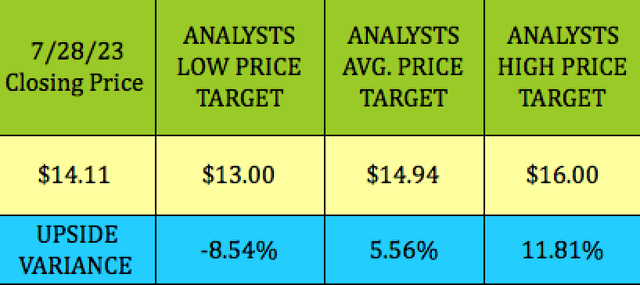
Insiders:
Various affiliates and employees of Blue Owl participated in an investment vehicle to purchase up to $25M of ORCC common stock in Q1 ’23. As of May 10, 2023, a total of $73.7 million of ORCC common stock was purchased, of which $49.1 million was bought by ORCC, at an average price of $12.22 per share. Insiders also bought ~88K shares in May at a price of $12.89 to $13.34.
fnvz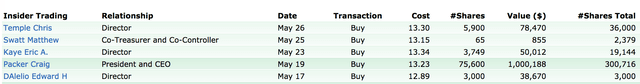
Valuations:
At $14.11 on 7/28/23, OBDC was selling at a ~7% discount to its NAV/share, much deeper than 1% BDC industry average discount. Its 9.1X price/NII was a bit lower than the 9.32X average.
Hidden Dividend Stocks Plus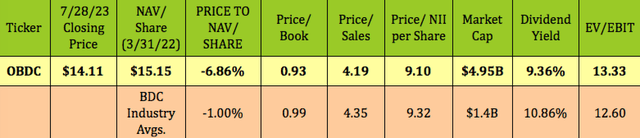
Parting Thoughts:
Like other BDC’s, OBDC has benefited from rising interest rates – its average base rate rose ~300 basis points since Q2 ’22. With the Fed telling us that it’s not done yet, BDC’s should continue to flourish. Another general tailwind for the industry is traditional banks’ declining participation in direct lending, although that doesn’t affect OBDC that much as of yet, since it does larger financing deals.
We rate OBDC a Buy, based upon its strong earnings, robust dividend coverage, and positioning as a large player in the BDC industry, which continues to have tailwinds. It reports Q2 ’23 earnings on Aug. 9.
All tables furnished by Hidden Dividend Stocks Plus, unless otherwise noted.
Credit: Source link


