

Tippapatt/iStock via Getty Images
Post Mortems: Win Some, Lose Some
We avoid discussing our owned businesses in public settings. It’s insidiously easy to overcommit to an idea when it’s intertwined with your identity. Yet we still believe in conducting thorough postmortems, even in the harsh glare of the public eye.
The rest of this letter will examine one winning investment and one wipeout.
Let’s get the bad news out of the way first…
Spark Networks (LOV)
Spark is a global purveyor of dating apps. They own niche brands like J-Date, Silver Singles, and Christian Mingle. The company surfaced on our radar after a friend who runs a small cap activist fund brought it to our attention.
Our first purchase was February 2021 at a price of $7.45.[1]
We bought more in July and August of 2021, and again in June of 2022.
We sold our last shares in March of 2023 at a price of $0.80, a disastrous outcome.
Where did we go wrong?
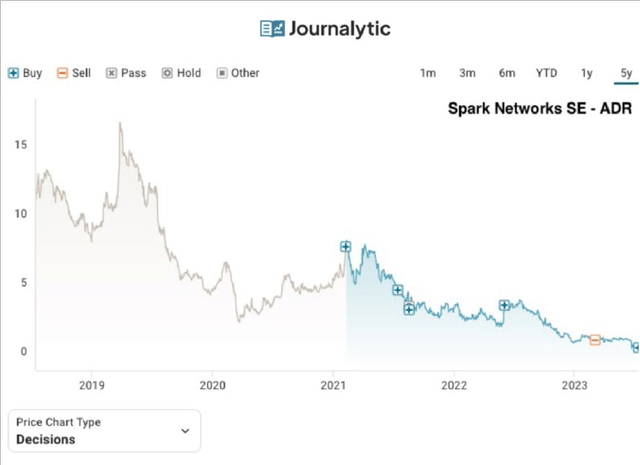
Similar to a sports team reviewing Monday morning film, we’ll use actual quotes from my investment journal[2] to tease apart the thought process in real time.
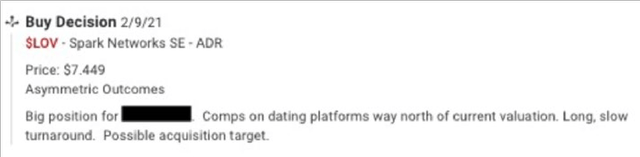
The initial thesis was simple enough: Spark would be acquired by one of their bigger competitors. At that time, Spark represented 7% of the revenue and 3% of the profits of the entire dating app industry. Their market cap was just 0.5% of that total. Not a bad setup.
We were betting that Spark’s fundamentals would hold out, or even improve, and they’d be purchased at a premium. We’ve had previous winners which rhymed with LOV.
Unfortunately, the company’s revenue continued to decline, profitability was intermittent, and management churned. Little surprise, the stock price mirrored the decaying business prospects.
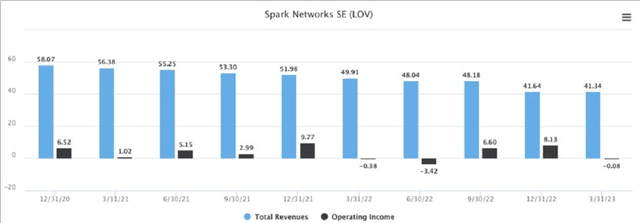
Yet we bought more in July.
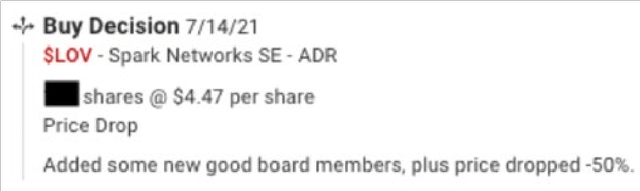
And August.
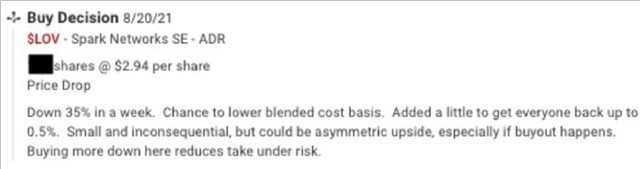
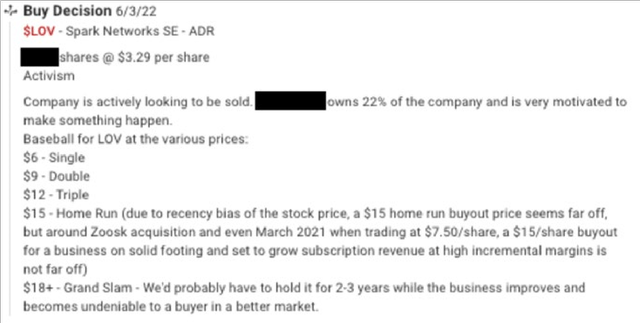
We bought our last shares in June of 2022 as the drumbeat for a sale increased.
Six months later, I was feeling the pull to consolidate the portfolio, prompting me to write the January 2023 Letter about Kill Criteria.[3]
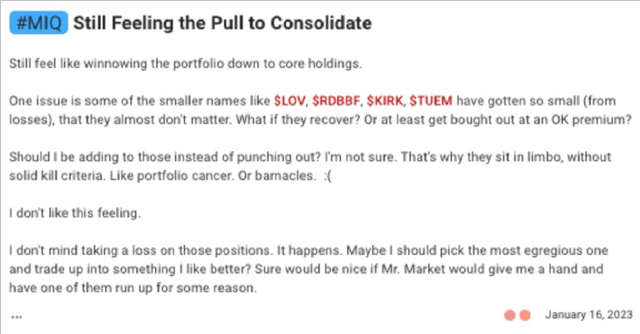
A prime example of Mr. Buffett’s observation that good businesses throw off easy decisions for owners, while bad ones present conundrums.
By March of 2023, I’d called it quits.
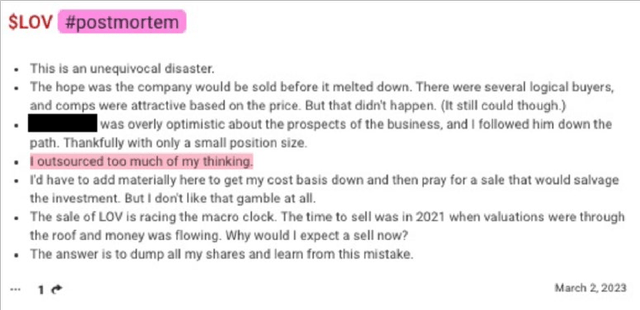
The prospects of Spark haven’t improved. The newest CEO recently resigned. Since we sold, the stock is down another -70% as this letter goes to print. It might be a grand slam from here, if the right buyer came along. But this cat who sat on the hot stove likely won’t be sitting on that cold stove either. I have a reminder set for a year from now to review my sell decision and see if I missed anything.
With that bit of nastiness out of the way, let’s deconstruct an investment which went well.
Chevron Corp (CVX)
We purchased our first shares of Chevron in March of 2020 at ~$76 per share.
We doubled down seven months later in October at ~$73 per share.
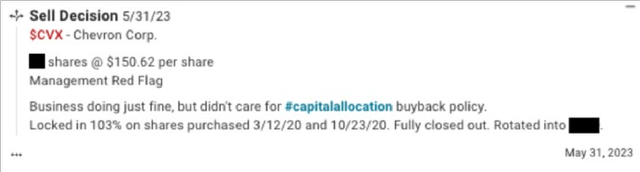
We exited in May of 2023 at a price of ~$150 per share.
We also received 22% of our cost basis back in dividends during our ownership. Our total return was ~+127% over 3 years (+31% annualized).
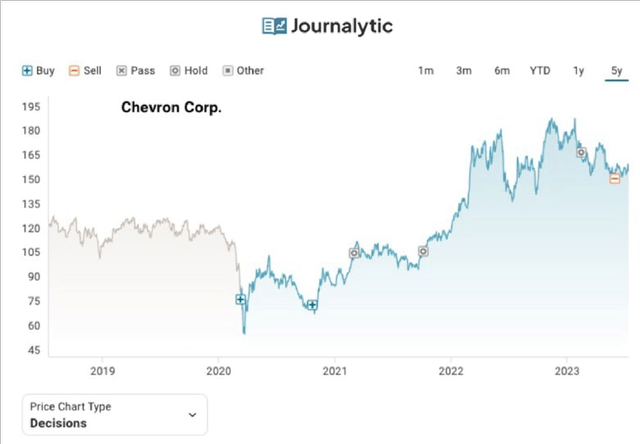
The story of buying Chevron was simple capital cycle theory.[4]
It’s easy to forget, but four of the top ten largest companies in the world in 2010 were oil companies.[5] Around that time, the oil industry had been pouring a ton of money into capital expenditures.
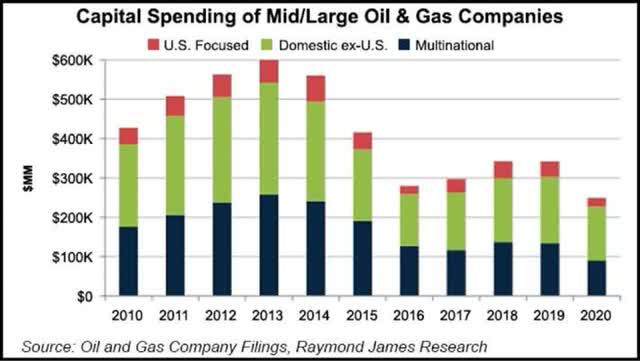
This led to an eventual supply glut. Oil prices dropped. The heat of competition evaporated the pool of industry earnings.
Price of Crude Oil Futures
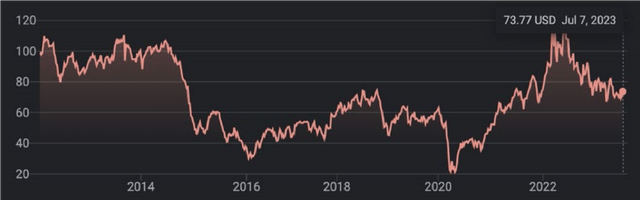
ESG concerns exacerbated energy industry woes. The term “uninvestable” was applied, which always causes my ears to perk up. In a sign of capitulation, on August 31st, 2020, Exxon Mobil was removed from the Dow Jones Industrial Index (after 92 years) and replaced with Salesforce.[6]
Covid was the final straw. A shut down world uses a lot less fuel. US crude finished April 20th, 2020, at -$37 a barrel. It was rumored enterprising individuals were being paid to fill up their swimming pools with oil.
This is what peak pessimism looks like.
I just had to get comfortable that oil and gas weren’t going away permanently. That the industry faced a cyclical problem, not a secular one.
I knew from simple physics how hydrocarbons support our entire modern world. We wouldn’t have transportation, electricity, food, plastics, chemical feedstocks, fertilizer, etc. Unless humanity accepted going back to lifestyles of the 1700s, we weren’t getting off hydrocarbons any time soon. I just needed the fortitude to buy, and trust in reversion to the mean.
I feel like I get paid for my strong stomach, rather than my exceptional analytical ability. – Joel Greenblatt
We bought Chevron in the darkest days of Covid. I looked back at the numbers in 2008 when oil prices were high and the company was humming with healthy cash flow. It was an attractive business in those salad days. Could it return to form?
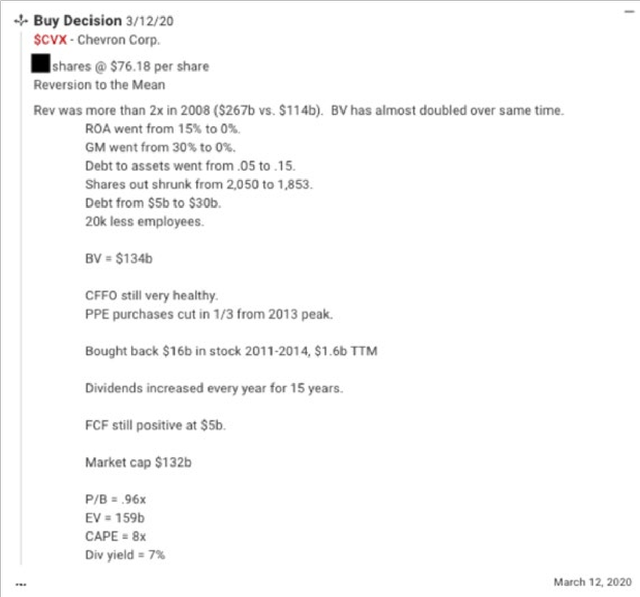
We bought more later in 2020. I was already concerned about inflation and interest rates rising. There were likely unintended consequences of all the global government stimulus. I saw the oil companies as potentially cheap hedges.
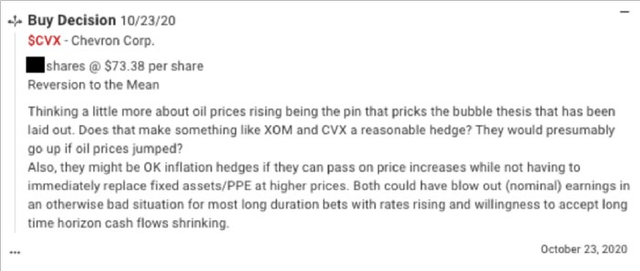
Buying below book value when oil prices were depressed, we were betting that oil would normalize and Chevron would be making a reasonable profit again. As Baron Rothschild summarized a lifetime of market experience: “Buy assets; sell earnings.”
And sure enough, Chevron saw a dramatic improvement in the business.
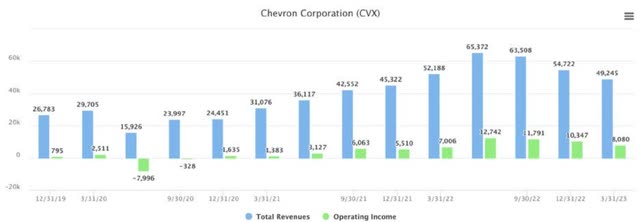
Revenues bottomed at $16 billion in Q2 2020. They grew to $65 billion two years later. Profits followed suit. Chevron made $42 billion in 2022, eclipsing 2008’s $35 billion. The fundamentals came back faster than I would have predicted.
What Are You Betting On?
The price of any security dictates the bet. Pay a fancy price, and you need increased scaling of revenue and profits, management execution, and pristine capital allocation to earn a satisfactory return. Pay a bombed out price, and you just need the company to survive another quarter to reveal slightly brighter prospects. That’s why Mr. Buffett has said, “Price is my due diligence.” You have to know what you’re betting on.
As oil prices recovered and the share price of Chevron increased, my thesis was forced to shift from “this company will benefit from reversion to the mean of oil prices” to “this company has well run operations and intelligent capital allocation.”
I didn’t feel like I was going out on a limb betting that oil prices should probably be positive. But I don’t have much of a view on today’s oil prices in the $70s. Your guess is as good as mine where we go from here.
Chevron’s operations are still quite strong. But unfortunately, they failed the capital allocation test for me. In May of 2023, I reviewed the results of Chevron’s buyback program over the last eight quarters. I noticed the company had reduced shares outstanding by 34 million, but had also issued $5.3 billion in stock based compensation to employees and management.[7]
My rough math was that $14 billion had gone out the door to retire 34 million cumulative shares. That equates to $421 per share. Compare that to the average stock price over that time of $142 per share.
This is poor stewardship of the outstanding claim tickets representing ownership in our company.
Management was getting over on shareholders, hardly an uncommon occurrence in Corporate America.

An uncomfortable amount of the economics were leaking from the owners to management. We exited in late May 2023.
Hopefully this review of the tape is a useful exercise to peek behind the investment curtain at Farnam Street. We’re looking for obvious opportunities in “uninvestable” situations, which come along infrequently. We want a “lock hand” in poker parlance, and to always understand the bets we’re actually making, as dictated by price.
As always, we’re thankful to have such great partners in this wealth creation journey.
Jake, Brian, Peter, and Jeannie
Footnotes[1] I’m using rough pricing based on my personal retirement account, which is representative of most of our client accounts at FSI. [2] Screen caps are from my investment journaling startup Journalytic. Revenue and Operating Income charts are from tikr.com. [3] I often use these letters as a way to hold my own feet to the fire. [4] See “Cupcake Cycle Theory” from the October 2019 Client Letterfor more on this natural phenomenon. [5] PetroChina, Exxon Mobil, BHP Billiton, Petrobras [6] Since the 8/31/20 switch, Exxon has appreciated +159% (plus dividends received). Salesforce is sitting -18% from that date (and has never paid a dividend). Apologies to all the indexers out there. [7] Stock based compensation effectively carves part of the company out for employees and management. Michael Mauboussin has found that SBC has been growing. For the Russell 3000, SBC in 2022 was $270 billion, amounting to 6-8% of total compensation and absorbing 1.2% of corporate revenue. In 2006, SBC was just 0.2% of revenue. The top decile is closer to 4.5%, a fairly large bite of the apple. |
Original Post
Editor’s Note: The summary bullets for this article were chosen by Seeking Alpha editors.
Editor’s Note: This article covers one or more microcap stocks. Please be aware of the risks associated with these stocks.
Credit: Source link