

Dragon Claws
Written by Nick Ackerman, co-produced by Stanford Chemist.
iShares Cohen & Steers REIT ETF (BATS:ICF) provides exposure to a basket of real estate investment trust exposure. It’s passively managed and based on the benchmark index of the Cohen & Steers Realty Majors Index. Cohen & Steers is one of the top REIT managers in the world.
They offer some of the most popular REIT closed-end fund structured products; Cohen & Steers Quality Income Realty Fund (RQI), Cohen & Steers Total Return Realty Fund (RFI) and Cohen & Steers REIT and Preferred and Income Fund (RNP). ICF can allow exposure to the criteria that Cohen & Steers look at when investing in their actively managed CEFs. It also has no leverage – similar to RFI – but it also doesn’t have to worry about discounts/premiums that come with CEFs. That can make it a relatively less volatile play for more conservative investors.
Of course, a drawback for some investors would be that the yield isn’t quite at a CEF level. This is because the fund simply pays out the dividends that it receives; it doesn’t offer a level-managed distribution policy that includes capital gains and return of capital that its CEF sisters have.
The Basics
- Dividend Frequency: Quarterly
- Dividend Yield: 2.81% (SEC yield 2.71%)
- Expense Ratio: 0.32%
- Leverage: N/A
- Managed Assets: $2.245 billion
- Structure: Passive ETF
ICF’s investment objective is to “track the investment results of an index composed of U.S. real estate investments trust.” Providing exposure to “large real estate companies that are dominant in their respective property sectors.”
The index it tracks is the Cohen & Steers Realty Majors Index. The methodology seeks to select a final 30 REITs. While it is a passive index, there is also C&S active management involved once the screening process narrows down the list. The full report can be read, but we’ll highlight the important points for index construction here.
First, they note that the process begins with focusing on larger REITs. Anything below a market cap of $500 million is eliminated. This makes sense as they seek the dominant player in each field. They don’t want startups that, despite having the potential for outsized returns, also have the opportunity to become a dumpster fire.
A second criterion for narrowing the universe of REITs down is for liquidating. Anything that doesn’t have at least 600k average trading volume per month for the previous 6 months is gone. This seems like a particularly low hurdle as many of the top REITs included in the index trade a million or more shares a day.
From there, that’s where the C&S management selects from the list the final 30 that “they believe best represent the Realty Majors investment criteria.”
After that, with weightings, they rank holdings by market cap and, based on that, are ranked “proportionate to each security’s market capitalization.” If any position weight is above 8%, the position is reduced, and everything below 8% weighting receives a proportional increase until it reaches 100%.
The rebalancing is done on the third Friday of February, May, August and November. While being included in the index requires the hurdles above, when it comes to quarterly deletions, the minimums are set a bit lower. A REIT can fall to a $400 million market cap and have a 500k average monthly trading volume before being removed.
The quarterly review criteria are less stringent than the initial criteria in order to provide a buffer, thereby avoiding unnecessary turnover resulting from a security that may have temporarily moved below the minimum requirements.
Thanks to the massive size of BlackRock (BLK) and being the most popular ETF sponsor with its iShares, the fund’s expense ratio comes in at a low 0.36%, below the median of 0.49% for all ETFs. However, it is higher than The Real Estate Select Sector SPDR ETF (XLRE) at a 0.10% expense ratio and the 0.12% Vanguard Real Estate Index Fund ETF (VNQ). On the other hand, it’s lower than its closely related iShares U.S. Real Estate ETF (IYR) cousin at an expense ratio of 0.39%.
Weak REIT Environment
We all know more recently that REIT performance has been terrible. While I’m always interested in the REIT space as an income investor, this is actually a more exciting time to consider REITs due to valuations being driven lower. The largest driving factor for the REIT sell-off has been rising interest rates. It hurts in multiple ways for this space.
REITs, as income-oriented investments, become less attractive when risk-free yields climb. Additionally, one way for REITs to grow earnings and size is through issuing debt. REITs payout a large portion of their cash flows as dividends to investors and retain relatively little compared to C-Corps. Therefore, when interest rates rise and debt becomes more expensive, it can be harder to make a deal work with higher costs on new debt offerings. It also impacts floating rate debt that’s already out there on balance sheets.
With that being said, if you are expecting a more aggressive rate hiking environment, REITs are probably an avoid for you. If you believe that REITs are more attractively valued and offer a potential long-term opportunity, then something like ICF could be worth considering.
Closed-end Fund Comparison
Over the last decade, ICF has delivered lower results than RQI, RNP and RFI. RFI is a non-leveraged CEF with a fairly higher weighting to common stock REIT positions. However, it should be noted that the CEFs also have exposure to preferred investments – and not in the REIT space, primarily in the financial sector, from banks and insurance companies.
YCharts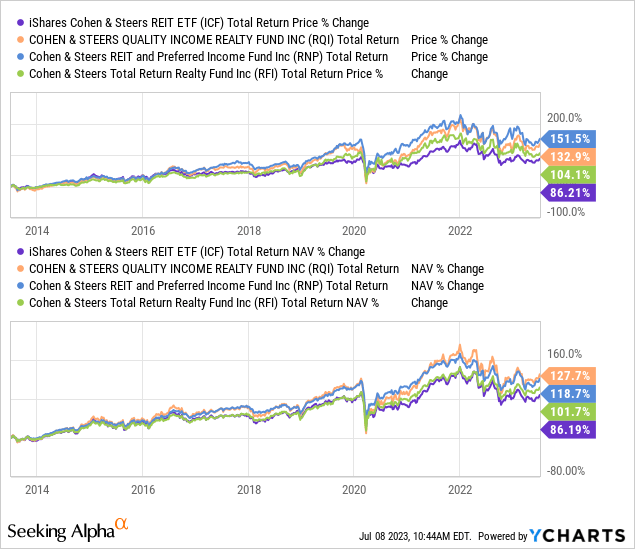
Despite not having leverage, ICF actually performed nearly identically to RQI during 2022. That’s certainly not something I would have anticipated, given the down year for the REIT space. As we saw, RFI was able to be the top performer through the year, and that is something I would have expected, with ICF performing similarly to RFI.
YCharts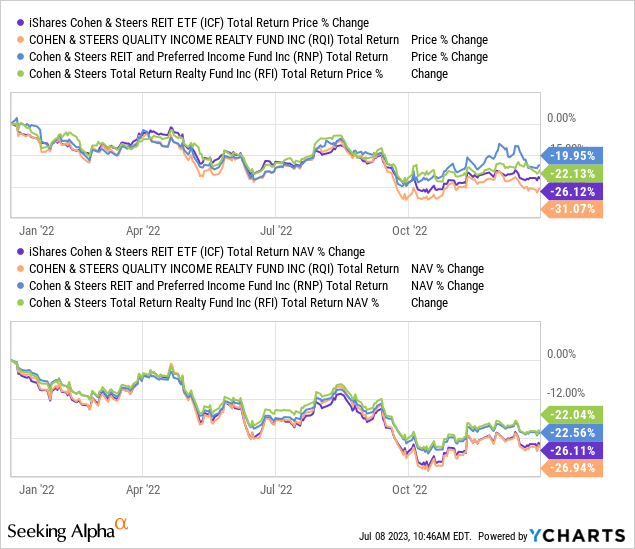
One area that has been helping the CEFs is that most of their leverage for RQI and RNP is at fixed rates because of interest rate swaps. That means they hedged and are not getting those higher borrowing costs just yet that other leveraged CEFs are currently contending with.
One of the reasons to still choose ICF over CEFs is if you are worried about discounts/premiums. As we can see above, IF and RQI performed similarly through 2022. However, investors sold off RQI even harder in the last year, resulting in more substantial losses on a total share price basis. Discounts/premiums for CEFs create some of the best opportunities, but they can also be one of the more frustrating aspects for investors with little patience.
ETF Peer Comparison
Interestingly, ICF, in the last decade, has been the top performer over VNQ and IYR. This is despite the higher expense ratio that comes with ICF. XLRE has been left off the list, as it would have limited our lookback period to only the end of 2015 when it was incepted.
YCharts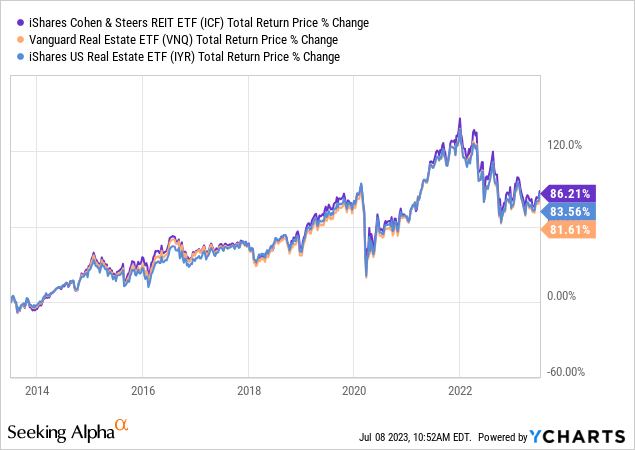
When looking at the performance of 2022 specifically, we can see that all four passively managed funds came in at pretty much negligible differences. That is, quite frankly, all did terrible.
YCharts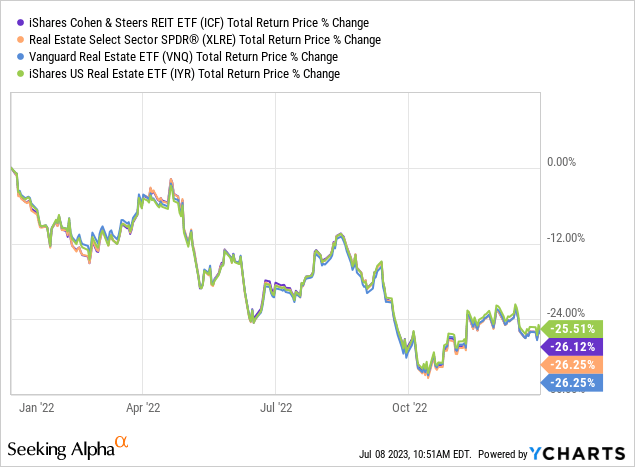
Dividend
The fund pays a quarterly dividend, and the yield is going to be at a much lower rate than CEF investors are probably going to find enticing, with the latest dividend actually annualizing out to just 1.5%. The SEC yield comes out to 2.71%, and the 12-month trailing yield is more respectable at 2.81%. That’s more likely the forward yield than based on the last. This is because the latest payout was actually one of the lowest.
ICF Distribution History (Seeking Alpha)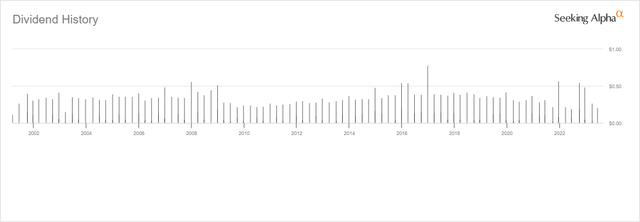
On a side note, ICF has two splits in its history. A 2 for 1 in 2005 and one in 2020. If it isn’t split-adjusted, the payouts could look like they’ve fallen dramatically, depending on where you are looking at the dividend data. So while the latest dividend has been lower, it isn’t as much of a fall as some sites may show. Fortunately, Seeking Alpha does provide the split-adjusted amounts to more accurately show dividend history in the above graph.
Of course, an ETF is what it holds. REITs might be income-oriented investments, but most of the largest holdings for ICF actually pay relatively low yields compared to the sector. Instead, they seem to focus on the more growth-oriented REITs. Yields have risen higher lately, but that’s mostly due to prices dropping on these holdings. However, many of these REITs also raise their dividends every year, which can also help the yield.
ICF Dividend Yield (Seeking Alpha)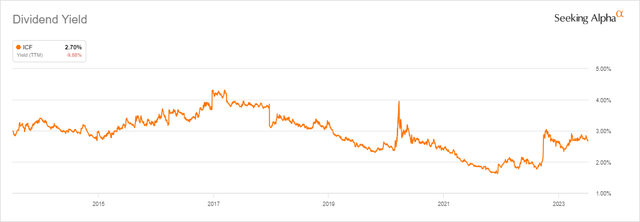
For tax purposes, the entire dividend in the last two years was classified as ordinary income.
ICF Distribution Classification (BlackRock)
ICF’s Portfolio
The largest exposure for ICF is the tower REITs.
ICF REIT Sector Exposure Breakdown (BlackRock)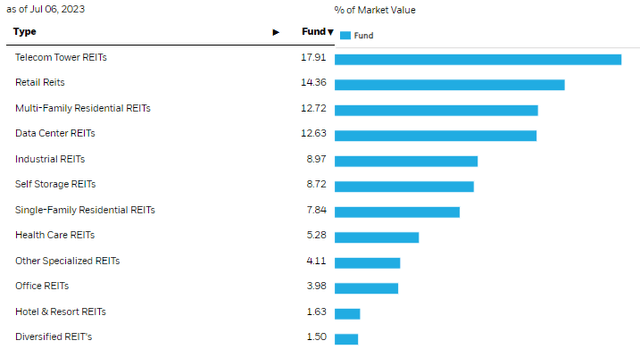
That’s represented by the largest and probably best-known American Tower (AMT) and Crown Castle (CCI). These are both top positions in the fund. Those two make up 14.5% of the fund. SBA Communications (SBAC) is also the other position; it just isn’t a top ten holding with a weighting of 3.42%. These would generally be more growth-oriented REITs, even if their growth has taken a bit of a pause.
ICF Top Ten Holdings (BlackRock)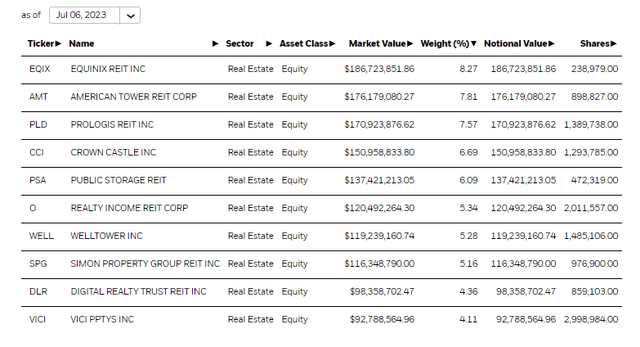
Topping AMT’s exposure is Equinix REIT (EQIX). This data center REIT is a good example of the more growth-oriented portfolio that ICF is tilted towards. Data center exposure makes up 12.63% of the fund, and while EQIX is the largest, we also see that Digital Realty Trust (DLR) comes in as the 9th largest position in ICF overall. That comprises the entire data center exposure of ICF.
The second sector exposure for ICF is to retail REITs. In the top ten, that includes Realty Income (O), probably the most popular amongst all REITs, and then Simon Property Group (SPG). SPG is another popular play in retail, but they are more mall oriented. Some investors (including myself) are more skeptical of such a holding. Fortunately, it is in a diversified basket, and if you are going to own a mall REIT, that appears to be the best in the worst neighborhood.
With prices falling, DLR’s dividend yield has actually risen above O’s at this point. DLR is also getting quite close. Historically though, O and SPG were the two that have generally carried the highest yields.
YCharts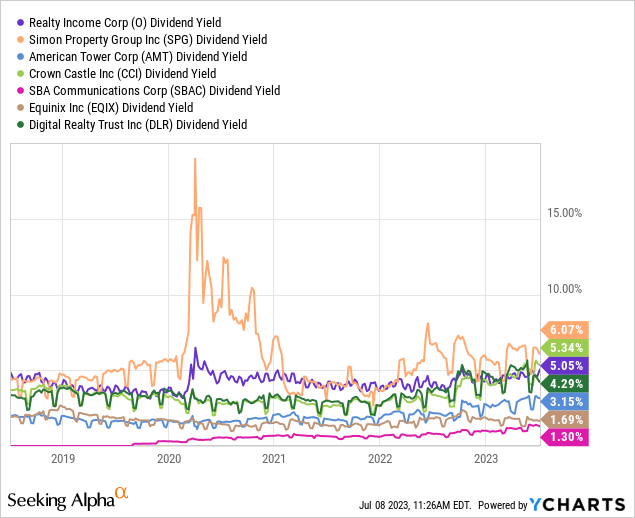
When looking at the growth of the dividends in the last few years, SPG was the most impacted by Covid. Admittedly, they’ve been doing a great job bringing the payout back up since, though. SBAC has been the most aggressive in reading its payout, followed by AMT.
YCharts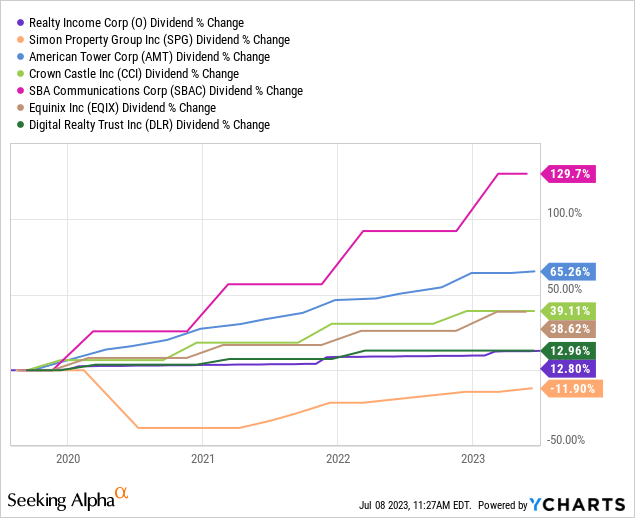
AMT had been raising their dividend every quarter, but in Q4 2022 and Q1 2023, they held steady; since then, they raised once again in Q2 2023. However, it shows that they aren’t too worried about keeping the trend of quarterly raises alive. Instead, probably rightfully so, they are more concerned about keeping their balance sheet strong in the face of rising rates.
DLR has also been a slow dividend raiser, including no dividend raise now for six quarters straight. Despite being in a field of ‘growth,’ they haven’t managed to keep up with EQIX and have come close to being similar to O’s dividend increases. This was probably a smart move, as the latest earnings showed that diluted FFO actually declined a touch year-over-year to $1.66 from $1.67. EQIX, on the other hand, was able to deliver FFO of $5.87 compared to $4.75.
In the trailing twelve months, EQIX has put up FFO of $21.02, an increase from $17.52 in the prior period. An increase of nearly 20%. DLR for the TTM is looking at an FFO of $6.70 compared to $6.53. That translates into growth of around 2.54%. Not nothing, but definitely not operating at the same level as its larger peer.
The fund carries minimal exposure to office, which has also been a positive for ICF. Overall, office REITs make up a small amount of the sector but have done a lot of damage. One of the positions is Alexandria Real Estate Equities (ARE). That’s the largest office exposure for ICF and is a bit unique as it’s a life sciences REIT and not your ordinary ‘office’ exposure.
Conclusion
ICF is a passively managed ETF. There is a methodology for screening positions in the index it tracks. However, a bit of active management is involved here, too, as Cohen & Steers allows for the final say on what’s ultimately included in the Cohen & Steers Realty Majors Index.
The C&S CEFs are quite popular due to their strong relative performance to REIT CEF peers. They also offer enticing distribution rates. So while ICF doesn’t compete against those in terms of its dividend yield, it can still provide solid total return results. One also wouldn’t have to contend with the discount and premiums of CEFs, which can make it more appropriate for conservative investors.
Credit: Source link