
• bitcoinBitcoin(BTC)$79,646.00-1.91%
  • ethereumEthereum(ETH)$2,450.97-1.89%
  • tetherTether(USDT)$1.000.02%
  • binancecoinBNB(BNB)$718.87-0.74%
  • rippleXRP(XRP)$1.40-4.33%
  • usd-coinUSDC(USDC)$1.000.01%
  • solanaSolana(SOL)$101.76-2.29%
  • tronTRON(TRX)$0.3317060.33%
  • Figure HelocFigure Heloc(FIGR_HELOC)$1.041.29%
  • HyperliquidHyperliquid(HYPE)$84.11-2.21%
  • zcashZcash(ZEC)$1,025.738.03%
  • dogecoinDogecoin(DOGE)$0.084594-3.53%
  • RainRain(RAIN)$0.016561-3.35%
  • USDSUSDS(USDS)$1.00-0.01%
  • moneroMonero(XMR)$517.24-0.56%
  • chainlinkChainlink(LINK)$11.60-1.88%
  • whitebitWhiteBIT Coin(WBT)$73.19-1.11%
  • leo-tokenLEO Token(LEO)$9.21-1.25%
  • cardanoCardano(ADA)$0.210399-4.96%
  • stellarStellar(XLM)$0.179038-2.76%
  • bitcoin-cashBitcoin Cash(BCH)$249.41-3.22%
  • daiDai(DAI)$1.00-0.01%
  • Ethena USDeEthena USDe(USDE)$1.000.00%
  • USD1USD1(USD1)$1.000.00%
  • CantonCanton(CC)$0.106777-5.46%
  • litecoinLitecoin(LTC)$50.72-1.13%
  • the-open-networkGram (prev. Toncoin)(GRAM)$1.391.01%
  • uniswapUniswap(UNI)$6.12-4.59%
  • hedera-hashgraphHedera(HBAR)$0.077703-1.78%
  • Global DollarGlobal Dollar(USDG)$1.00-0.01%
  • avalanche-2Avalanche(AVAX)$7.35-2.17%
  • suiSui(SUI)$0.75-3.75%
  • shiba-inuShiba Inu(SHIB)$0.000005-3.32%
  • paypal-usdPayPal USD(PYUSD)$1.00-0.01%
  • BlackRock USD Institutional Digital Liquidity FundBlackRock USD Institutional Digital Liquidity Fund(BUIDL)$1.000.00%
  • nearNEAR Protocol(NEAR)$2.138.94%
  • tether-goldTether Gold(XAUT)$4,427.14-0.87%
  • crypto-com-chainCronos(CRO)$0.055713-3.63%
  • Circle USYCCircle USYC(USYC)$1.140.04%
  • MemeCoreMemeCore(M)$1.126.76%
  • Ripple USDRipple USD(RLUSD)$1.000.00%
  • okbOKB(OKB)$108.17-0.95%
  • Ondo US Dollar YieldOndo US Dollar Yield(USDY)$1.140.20%
  • BittensorBittensor(TAO)$222.69-1.36%
  • aaveAave(AAVE)$129.85-2.45%
  • AsterAster(ASTER)$0.742.71%
  • pax-goldPAX Gold(PAXG)$4,432.86-0.94%
  • mantleMantle(MNT)$0.570.55%
  • World Liberty FinancialWorld Liberty Financial(WLFI)$0.056132-2.26%
  • MorphoMorpho(MORPHO)$2.563.06%
TradePoint.io
  • Main
  • AI & Technology
  • Stock Charts
  • Market & News
  • Business
  • Finance Tips
  • Trade Tube
  • Blog
  • Shop
No Result
View All Result
TradePoint.io
No Result
View All Result

Flex: Strong Trends Ahead Of Quarterly Results, Margins In Focus (NASDAQ:FLEX)

July 16, 2023
in Market & News
Reading Time: 5 mins read
A A
Flex: Strong Trends Ahead Of Quarterly Results, Margins In Focus (NASDAQ:FLEX)
ShareShareShareShareShare

onurdongel

YOU MAY ALSO LIKE

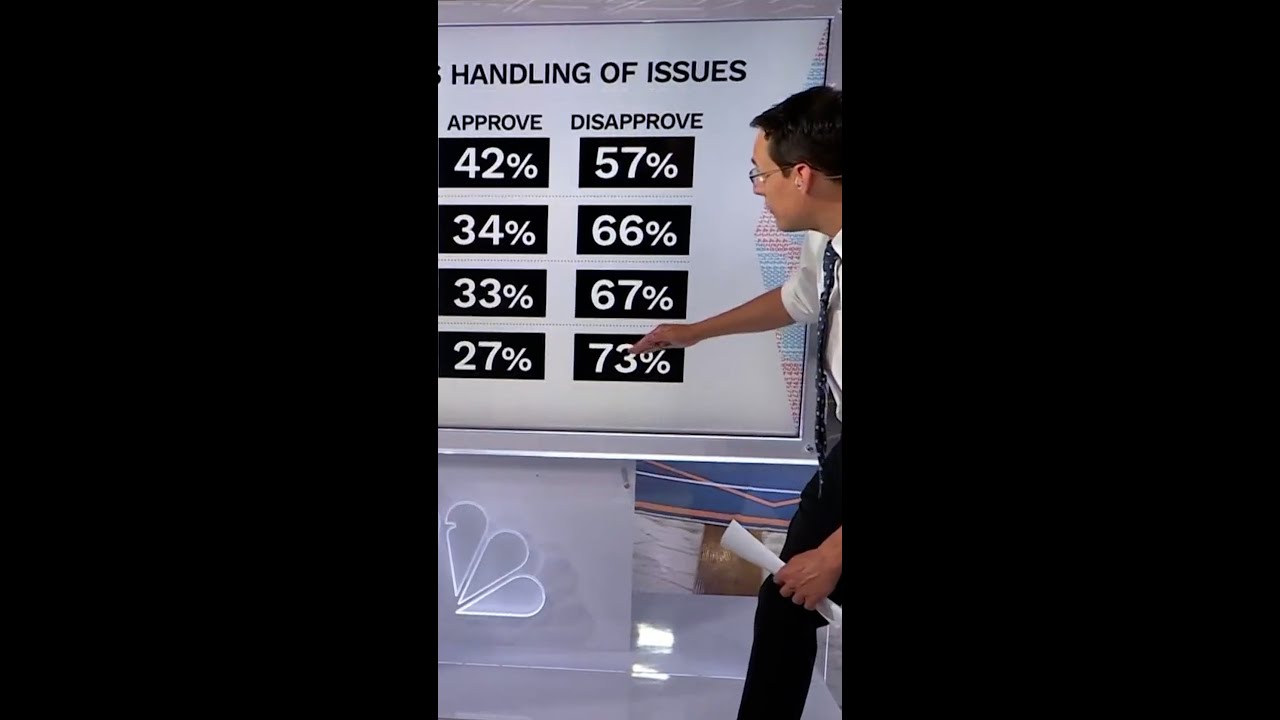
Kornacki on Trump’s approval rating 100 days before midterms

The battleground states that could flip Congress for Democrats

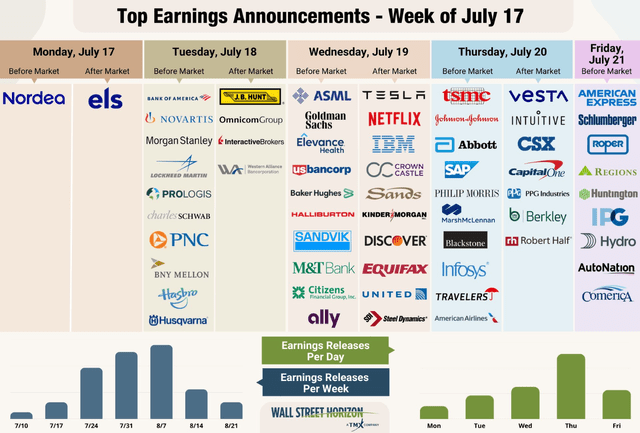
Earnings season amps into full swing this week with many big names issuing Q2 results. So far, according to FactSet, 80% of S&P 500 have topped analysts’ earnings expectations, though just 6% of the SPX’s market cap has reported. One name I was bullish on last year issues its Q1 2024 figures next week.

After not analyzing the name for many months, I reiterate a buy rating on Flex Ltd. (NASDAQ:FLEX) for its still-strong valuation and robust technical trends.

Earnings Season In Full Swing

Earnings Season In Full Swing

Wall Street Horizon
According to Bank of America Global Research, FLEX is a global provider of vertically integrated supply chain services starting from PCB fabrication, design, engineering, and manufacturing services through after-sales support. The core business includes the Reliability Solutions and Agility Solutions segments.

The Singapore-based $12.4 billion market cap Electronic Manufacturing Services industry company within the Information Technology sector trades at a slightly modest 16.2 trailing 12-month GAAP price-to-earnings ratio and does not pay a dividend, according to Seeking Alpha. Ahead of earnings on the 26th, FLEX features a moderate implied volatility reading of 29% and the stock has a low 1.7% short interest percentage.

Back in May, the company issued strong Q4 2023 results. EPS verified at $0.57 which topped estimates of $0.51. Revenue also came in solid at $7.5 billion, a 9% jump from the same period a year earlier. The management team offered guidance for the quarter that just finished – they expected Q1 2024 revenue in the $7 to $7.5 billion range and adjusted EPS between $0.47 and $0.53.

Its full-year guidance was particularly impressive, implying healthy incremental margin improvement driven by secular growth trends, though its lifestyle and consumer devices segments may keep experiencing headwinds. More broadly, the company’s transition to a higher margin mix of end markets along with consistent free cash flow generation and profitability remain compelling features.

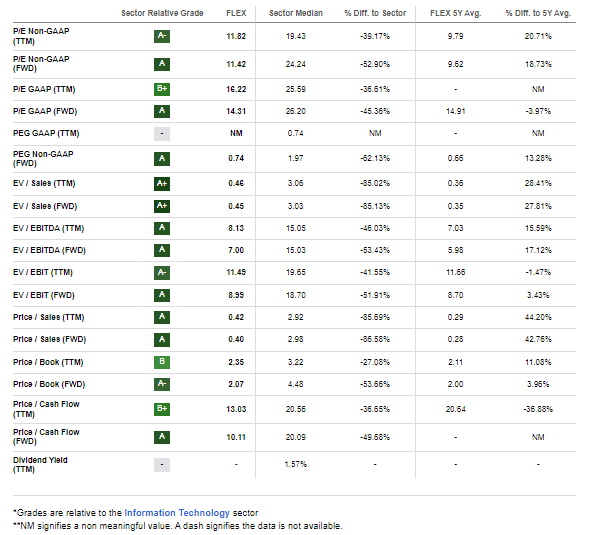
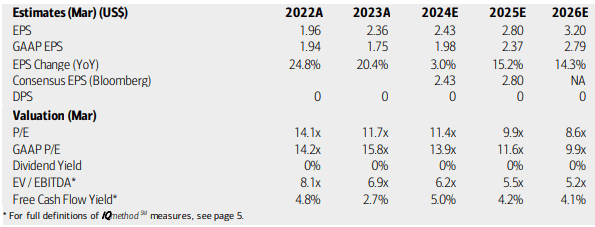
On valuation, analysts at BofA see earnings climbing at a slow rate this year (FY 2024) but per-share profits are expected to accelerate in the out year. Moreover, EPS may top $3 on an operating basis come 2026. The Bloomberg consensus outlook is on par with the BofA projects. Even with decent and steady free cash flow, no dividends are expected to be paid on this tech stock. Still, with low-teen non-GAAP P/E multiples and a PEG ratio well below 1, I continue to like the valuation situation.

FLEX: Valuation, Earnings, Free Cash Flow Forecasts

FLEX: Valuation, Earnings, Free Cash Flow Forecasts

BofA Global Research
With an EV/EBITDA ratio that is less than half that of the broad market, if we simply apply a 16 P/E (slightly less than the sector median given modestly softer EPS growth rates assumed), then the stock should be near $40 if we assume $2.50 of next-12-month per-share profits. Thus, the stock continues to sport value.

FLEX: Impressive Valuation Metrics, A Strong GARP Play

FLEX: Impressive Valuation Metics, A Strong GARP Play

Seeking Alpha

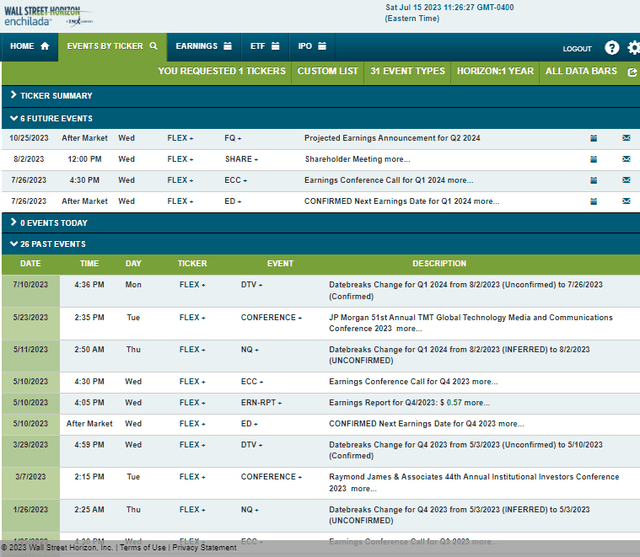
Looking ahead, corporate event data from Wall Street Horizon shows a confirmed Q1 2024 earnings date of Wednesday, July 26 AMC with a conference call immediately after results hit the tape. You can listen live here. Potential volatility doesn’t end there, though. The firm holds its annual shareholders’ meeting on Wednesday, August 2.

Corporate Event Risk Calendar

Corporate Event Risk Calendar

Wall Street Horizon
The Technical Take

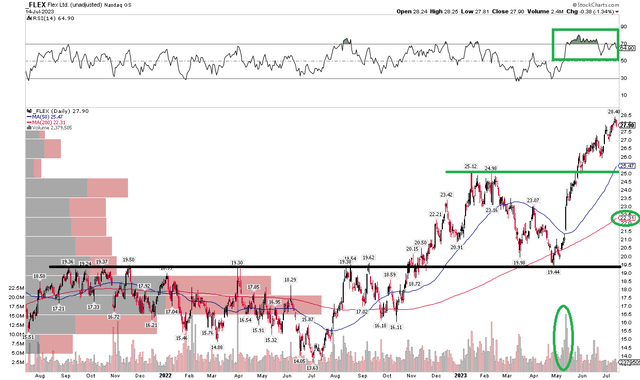
With a solid growth trajectory beyond this year, a compelling valuation, and earnings on tap, how does the chart look? Notice in the graph below that FLEX has done all the right things in my view. Shares broke out from a consolidation range in late 2022. The rally paused near $25, but it was not cause for panic as FLEX simply went on to retest noted support at $20.

After probing, but holding the 2021-22 range highs, FLEX took off. Just earlier this month, $28.40 was touched, marking a nearly 50% rally off the early May nadir. Today, the long-term 200-day moving average is upward-sloping and the near-term trend is clearly higher, as gauged by the 50-day moving average. There is some minor bearish divergence in the RSI momentum indicator at the top of the chart, but overall, the RSI reading continues to hover in the bullish 40 to 90 zone.

Long here with a stop under the Q1 highs makes sense. Longer-term investors could also consider placing a sell stop further down, under the December 2022 and April 2023 peaks around $23.

FLEX: Bullish Uptrend, Eyeing $25 Support

FLEX: Bullish Uptrend, Eyeing $25 Support

Stockcharts.com
The Bottom Line

I reiterate my buy rating on FLEX stock. I see fair value near $40 while the technical trend is bullish and momentum is strong.

Credit: Source link

ShareTweetSendSharePin

Related Posts

Kornacki on Trump’s approval rating 100 days before midterms
Market & News

Kornacki on Trump’s approval rating 100 days before midterms

September 4, 2026
The battleground states that could flip Congress for Democrats
Market & News

The battleground states that could flip Congress for Democrats

September 4, 2026
Firefighters battle major wildfire in Castellón, Spain
Market & News

Firefighters battle major wildfire in Castellón, Spain

September 4, 2026
German leaders on manhunt for suspect in Berlin Pride attack
Market & News

German leaders on manhunt for suspect in Berlin Pride attack

September 4, 2026
Next Post
Uber CEO Calls This a ‘Scarier Time’ Than 9/11

Uber CEO Calls This a 'Scarier Time' Than 9/11

Leave a Reply Cancel reply

Your email address will not be published. Required fields are marked *

Search

No Result
View All Result
Pope Leo XIV to host ‘Concert for Peace’ in Italy

Pope Leo XIV to host ‘Concert for Peace’ in Italy

September 3, 2026
Full Episode: TODAY Show – July 29

Full Episode: TODAY Show – July 29

September 3, 2026
Sen. Kennedy says he would maintain status quo with Iran

Sen. Kennedy says he would maintain status quo with Iran

August 30, 2026

About

Learn more

Our Services

Legal

Privacy Policy

Terms of Use

Bloggers

Learn more

Article Links

Contact

Advertise

Ask us anything

©2020- TradePoint.io - All rights reserved!

Tradepoint.io, being just a publishing and technology platform, is not a registered broker-dealer or investment adviser. So we do not provide investment advice. Rather, brokerage services are provided to clients of Tradepoint.io by independent SEC-registered broker-dealers and members of FINRA/SIPC. Every form of investing carries some risk and past performance is not a guarantee of future results. “Tradepoint.io“, “Instant Investing” and “My Trading Tools” are registered trademarks of Apperbuild, LLC.

This website is operated by Apperbuild, LLC. We have no link to any brokerage firm and we do not provide investment advice. Every information and resource we provide is solely for the education of our readers. © 2020 Apperbuild, LLC. All rights reserved.

No Result
View All Result
  • Main
  • AI & Technology
  • Stock Charts
  • Market & News
  • Business
  • Finance Tips
  • Trade Tube
  • Blog
  • Shop

© 2023 - TradePoint.io - All Rights Reserved!