
Sundry Photography
Earlier this month, President Biden visited South Carolina and announced a $60 million investment by Enphase Energy (ENPH) to manufacture the company’s microverters – currently being made in China, India, and Mexico – here in America. Enphase’s partner in the project is Austin, Texas, based Flex Ltd. (NASDAQ:FLEX) – a global supply-chain manufacturing giant that will actually build the finished product. Indeed, on July 5, Enphase announced it began shipments from Columbia, S.C., – its first production from a U.S. manufacturing site. This is a positive catalyst for Flex going forward. So too is the recent and very successful IPO spin-off of Flex‘s Netracker (NXT) segment. In addition, Flex is arguably undervalued with a forward P/E of only 11.4x after growing FY23 revenue 16.5% yoy.
Investment Thesis
Flex is a global leader in contract supply-chain electronic manufacturing services (“EMS”) for original equipment manufacturers, or OEMs, across a wide variety of sectors such as consumer devices, automotive (think EVs), and industrials.
Flex has more than 100 manufacturing sites across 30 countries on four continents. The company provides such services as printed circuit board (“PCBs”) fabrication, systems manufacturing and assembly, logistics, and other design and engineering services in support of OEMs. In general, FLEX should be a primary beneficiary of the trend to onshore supply-chain manufacturing to the U.S. (like the Enphase example mentioned above).
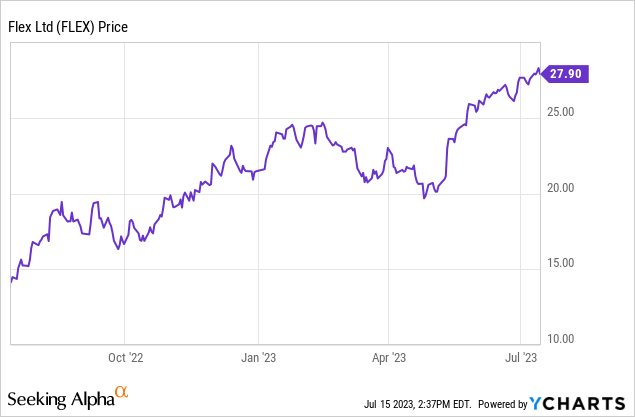
In FY23, FLEX grew revenue 16.5% yoy and rode increasing efficiencies to post a 20.4% increase in non-GAAP EPS of $2.36. Yet the stock closed Friday with a forward P/E of only 11.4x. As shown below, the stock has almost doubled over the past year, but in my opinion it still has farther to run based on its relatively low valuation in comparison to its growth potential:
Earnings
FLEX’s Q4FY23 EPS report was released on May 10th and was another strong showing:
- Revenue of $7.48 billion (+9.2% yoy) beat by $300 million.
- Non-GAAP EPS of $0.57 was a $0.06 beat.
- Adjusted free-cash-flow for FY23 was $335 million.
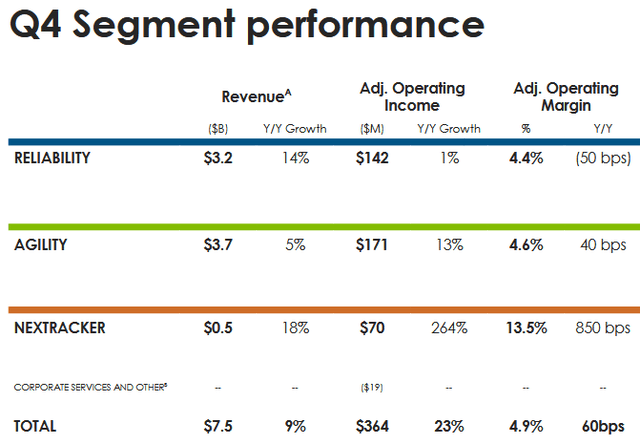
As can be seen in the slide below (taken from the Q4 Presentation), Flex saw Q4 revenue growth across all three segments while overall adjusted operating margin was 4.9% (+60 basis points yoy) and adjusted operating income of $364 million jumped 23% yoy:
FLEX
On the Q4 conference call, CEO Revathi Advaithi pointed out:
Looking at the full year results, fiscal ’23 was very strong despite the continuing challenges in the macroeconomic landscape. We grew revenue 17% year-over-year with adjusted operating margins for the full year at 4.8%. And we delivered adjusted EPS of $2.36, up – up 20%. That’s the third year in a row EPS has grown at least 20%.
As I mentioned earlier, that kind of demonstrated EPS growth appears to command a valuation level considerably higher than Flex‘s current forward P/E of only 11.4x.
Nextracker IPO
During the quarter (in February), FLEX completed the IPO of its solar-technology based Nextracker (NXT) segment, which despite a relatively tough IPO environment has arguably been a grand success:
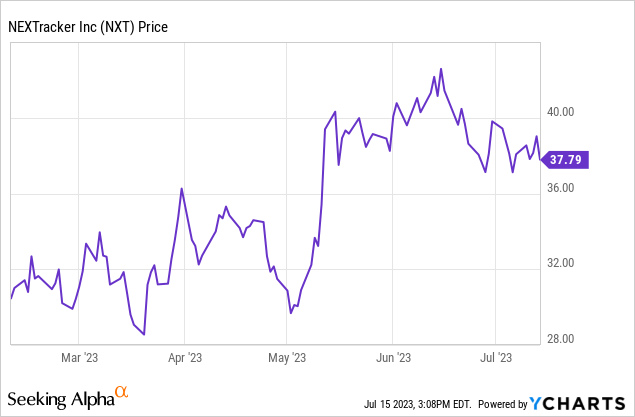
Nextracker’s technology optimizes solar power-plant performance by enabling solar panels to accurately track the path of the sun across the sky in order to maximize overall power generation.
Flex‘s strategy for the IPO is for Nextracker to thrive better as a stand-alone entity while maintaining a significant stake in the company. As noted in the above graphic, NXT was the smallest segment within Flex, but also was the fastest growing (revenue +31% yoy). In the latest SEC 10-K filing, Flex reported that “upon the closing of the IPO, Flex beneficially owned 61.4% of the total outstanding shares of Nextracker’s capital stock.”
On the previously mentioned conference call, FLEX also reported it had reduced debt by north of $300 million during FY23 and put $150 million of debt onto Nextracker as part of its IPO. FLEX ended the quarter with cash on hand of $3.3 billion, or an estimated $7.19/share based on the 459 million average shares outstanding.
Going Forward: Microinverters and FY24 Guidance
The Enphase microinverter development was not mentioned on the Q4 conference call. However, since that time – and as mentioned above – the microninverters went into production as of earlier this month. That being the case, I would expect FLEX to have some color commentary on the partnership on the Q1 FY24 conference call, which is scheduled for July 26th.
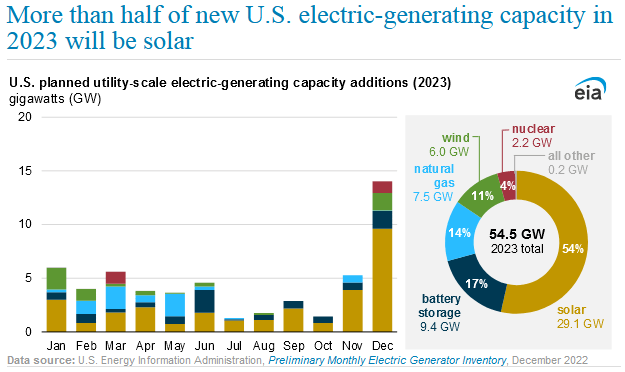
Regardless, it’s clear that microinverters have been the primary growth catalyst for Enphase for years, and should continue to be as the build-out of solar capacity is accelerating in the U.S. (and globally):
EIA
Meantime, the midpoint of FLEX’s FY24 guidance is as follows:
- Revenue of $31 billion.
- Adjusted non-GAAP EPS of $2.45/share.
That may not be too impressive as compared to FY23 results (i.e. revenue of $30.3 billion and non-GAAP EPS of $2.36) until you consider that the forward guidance does not include any contributions from the spun-off Netracker segment. However, note that the current market-cap of NXT is $6.2 billion and Flex had a 61.4% stake right after the IPO.
Competition
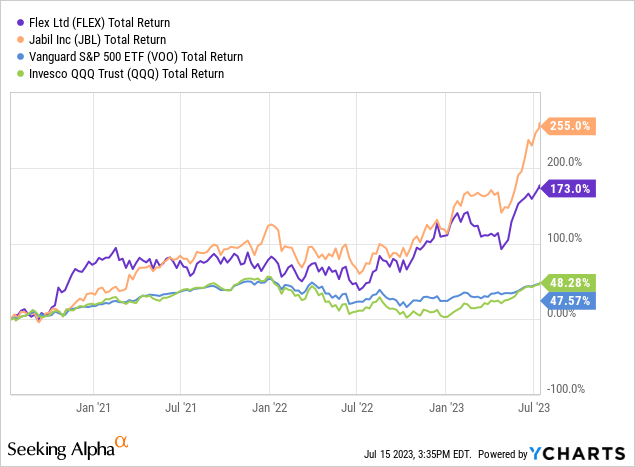
FLEX’s leading competitor is Jabil (JBL), a leading EMS contractor that I also view as being significantly undervalued in comparison to its growth rate. Indeed, both companies have significantly outperformed the broad market as represented by the Vanguard S&P500 ETF (VOO) and the Invesco Nasdaq-100 Trust (QQQ):
The table below compares the two companies on a number of valuation metrics:
| TTM Revenue | TTM EPS | TTM FCF/share | Forward P/E |
Shares Outstanding |
|
| FLEX | $30.35 billion | $1.72 | $0.73/share | 11.4x | 459 million |
| JBL | $35.3 billion | $7.12 | $7.55/share | 13.1x | 136.4 million |
Jabil is benefiting from a relatively low share count, a strong share buyback program, and continuing margin expansion. Note the stock is up over 40% since my Seeking Alpha analysis Jabil: Treat Yourself And Buy the 10% Dip was published on April 24.
Summary and Conclusion
I consider Flex (and Jabil as well …) to be in a very attractive position given the growth in the sub-sectors that require their supply-chain and EMS skill-set and services support: EVs, mobile consumer devices, renewable energy, cloud infrastructure, and data center/communications infrastructure – just to name a few. Both companies also appear to be significantly undervalued relative to their demonstrated growth rates. The recent announcement of the Enphase microinvestors going into production (manufactured by Flex) is a positive catalyst moving forward, as is the very successful NXT IPO. FLEX stock is a BUY.
Credit: Source link